How to analyze a Shoplift AB test in Google Analytics
In this recipe, we’ll walk through how to use Shoplift with Google Analytics segments to analyze test performance, including setting up segments to checking statistical significance.
Step 1: Install Littledata's Shopify to Google Analytics app
Running an AB test on your Shopify store can uncover what really drives conversions: a new layout, a changed CTA, or a different PDP photo. But no matter how well thought-out your test is, it can mislead you if your conversion tracking isn’t accurate.
That's because subtle differences between test and control groups' behavior mean a lot.
How can you tell that a 3% lift in purchases happened if you're not tracking 100% of your purchase events?
With Littledata’s Shopify to Google Analytics connection installed, your GA4 property receives all of your Shopify server-side events, including 100% of purchases, add-to-carts, and checkout steps.
Step 2: Set up Shoplift to Google Analytics
Follow Shoplift's instructions to connect Google Analytics.
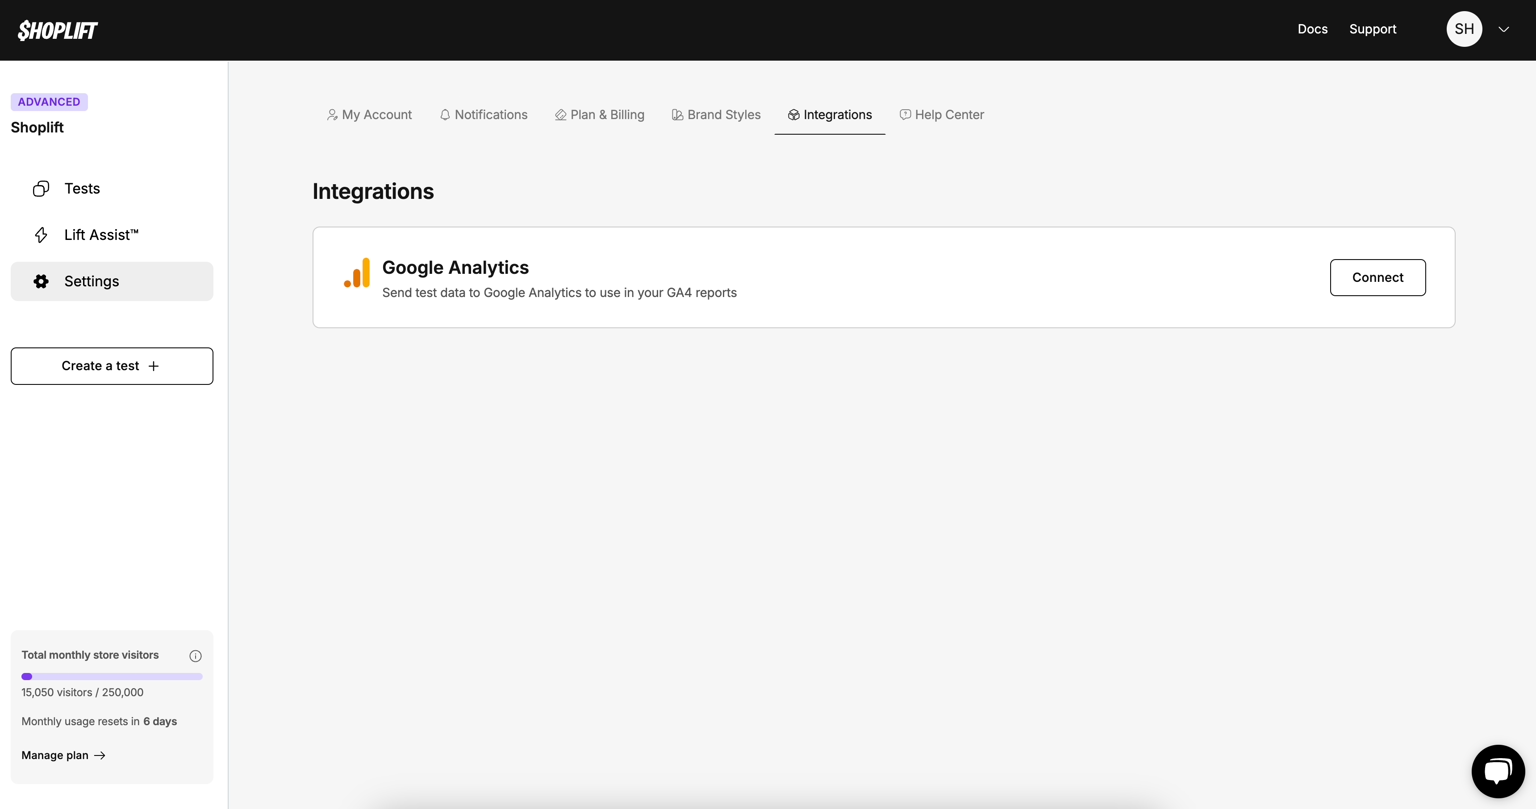
Shoplift then makes it easy to set up an AB test for Shopify, and name the variants - which we'll use in the reporting below.
How Shoplift sends data to GA4
Shoplift sends a special GA4 event called experience_impression to mark when a user sees a test or control version of your page. This event contains a parameter called exp_variant_string, which tells you whether the user was in the test or control group.
To view this:
Go to Reports > Engagement > Events in GA4
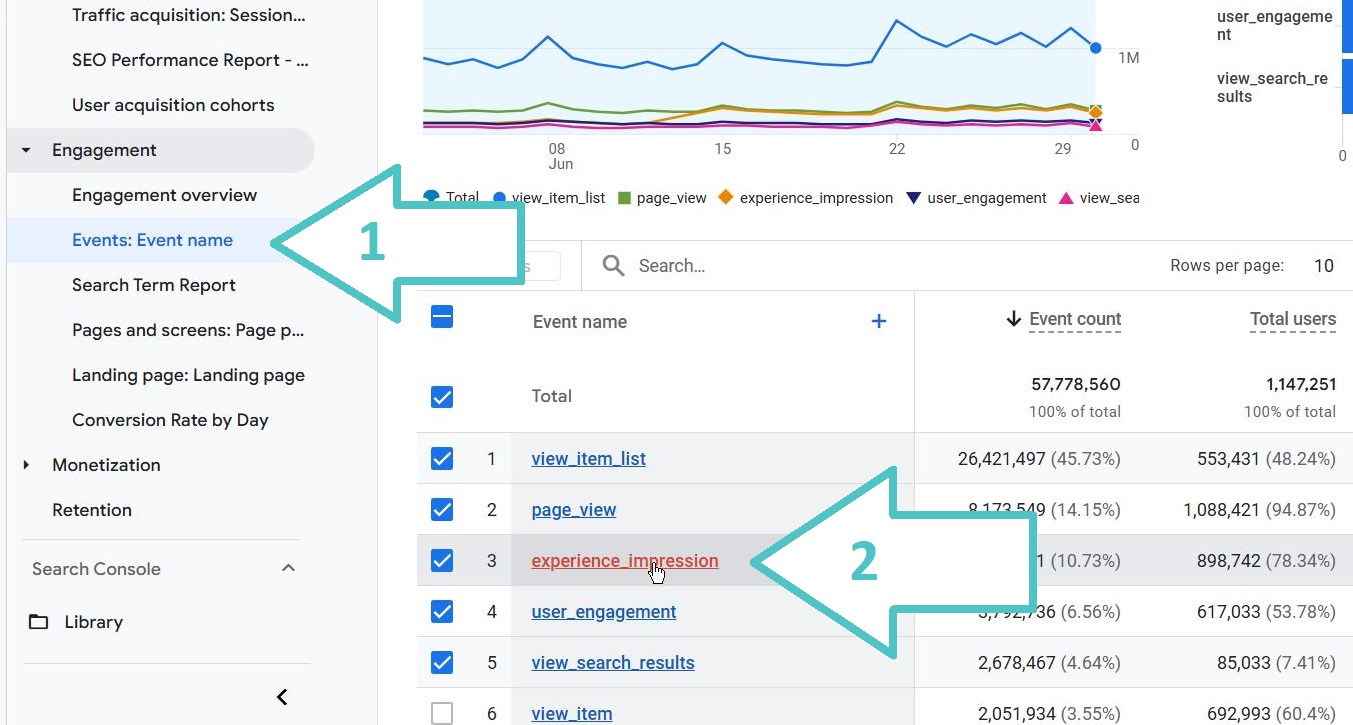
Click on the experience_impression event in the list
Look for the exp_variant_string parameter in the dropdown list of event parameters
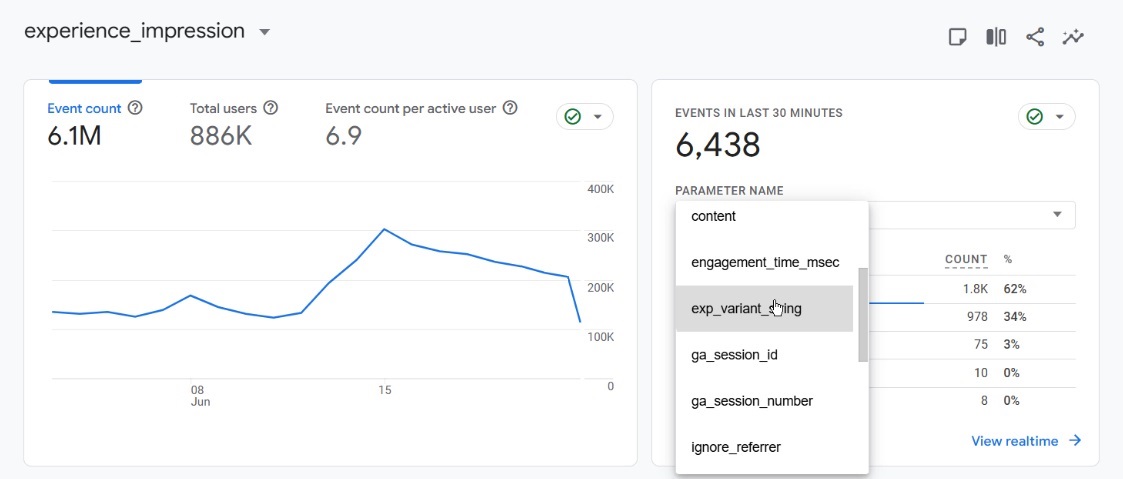
If you don’t see it, you’ll likely need to register it as a custom dimension first.
Register the exp_variant_string parameter
To make the parameter available in Explorations:
-
Go to Admin > Custom definitions > Custom dimensions
-
Click Create custom dimension
-
Choose the
exp_variant_stringevent parameter from the dropdown list
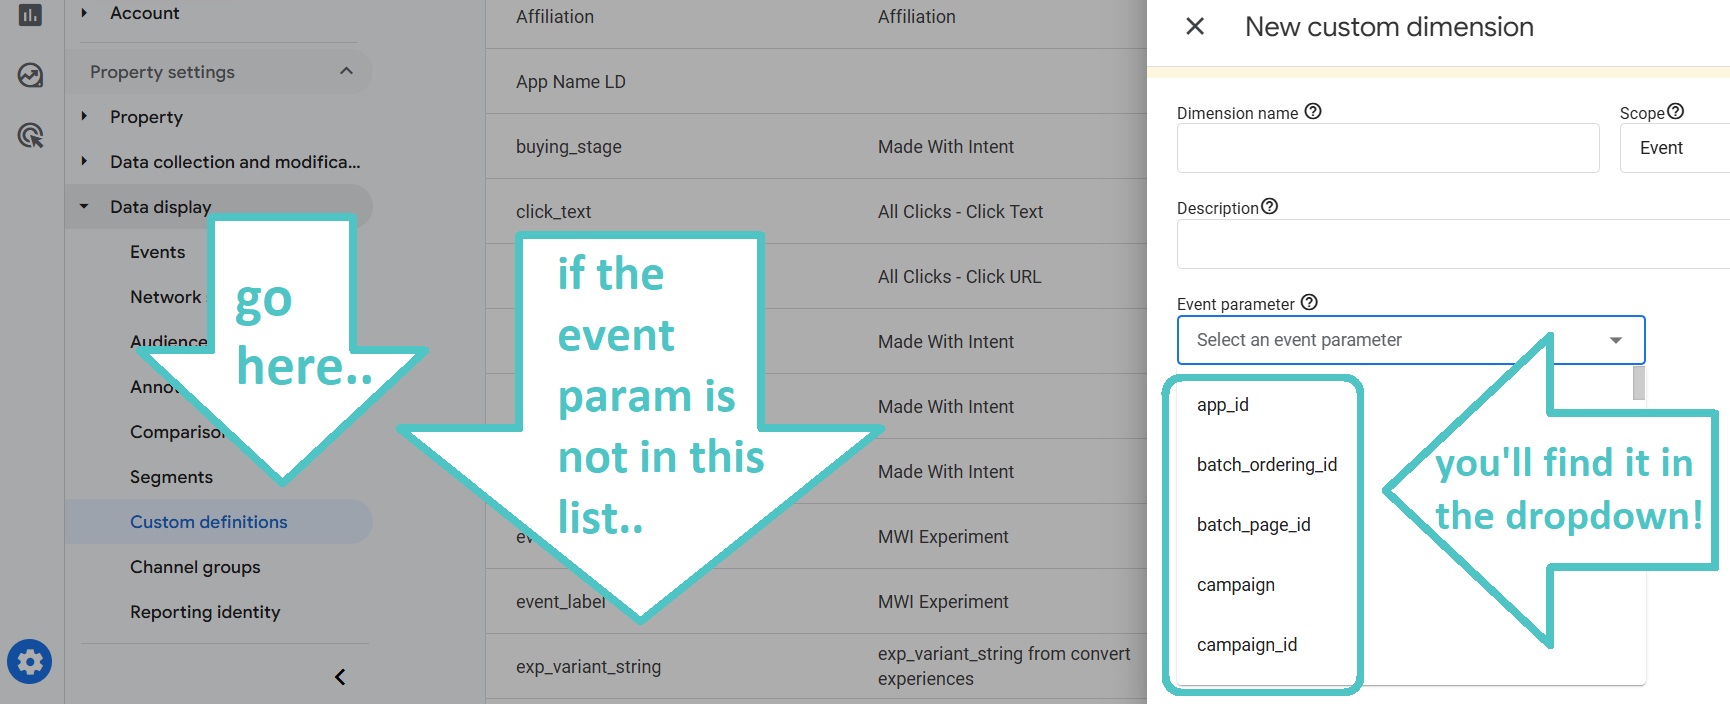
If the parameter has already been registered, it won’t appear in the dropdown - which is a good sign that you’re ready to move on.
Step 3: Create test and control segments in GA4
Now that the variant is visible, you’ll create two session segments - one where exp_variant_string contains the test name, and another where variant contains the control name. It’s the name you gave during the Shoplift test setup.
In GA4 go to Exploration section and create a new session segment. Set the condition: exp_variant_string contains [test_name] (for test) or [control_name] (for control)
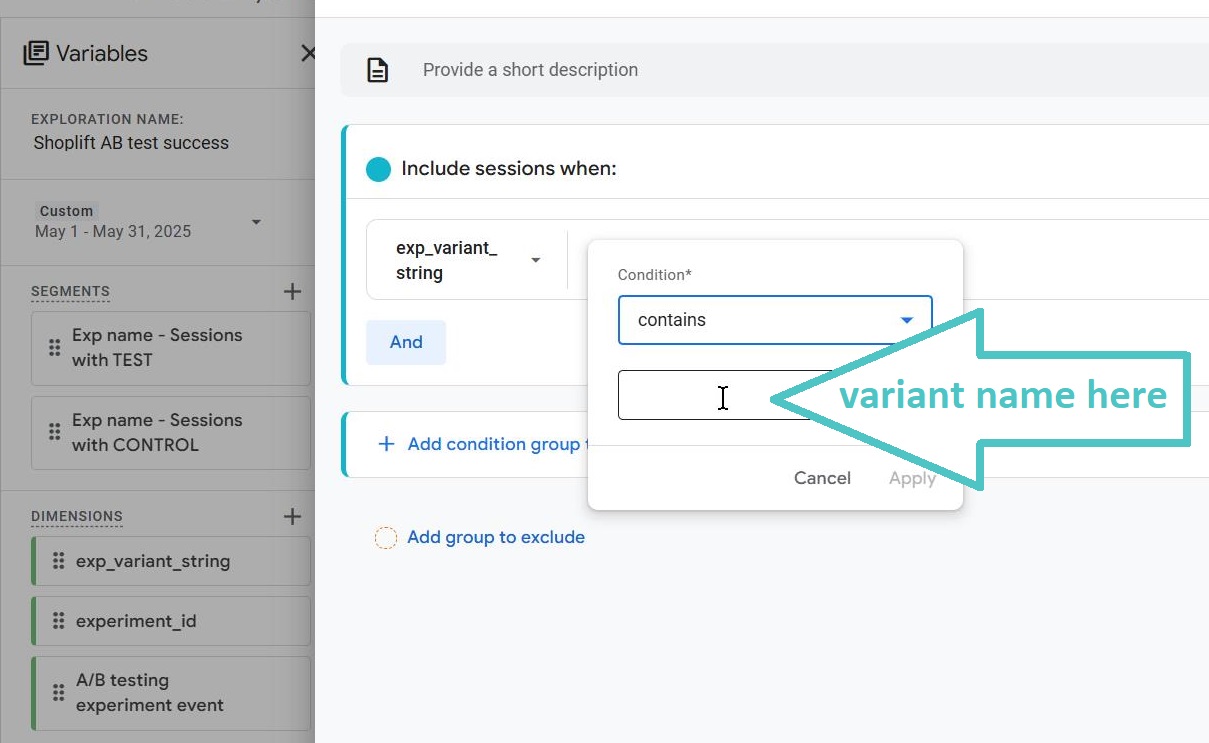
Once created, you’ll have two segments: “Test” and “Control.”
Read our full guide to Google Analytics Explorations
Step 4: Check your segments are mutually exclusive
To make sure your segmentation is working properly, we’re gonna use the Segment overlap technique in GA4: add both segments and make sure they are mutually exclusive and don’t overlap, or only very minimally (e.g., <1%)
If you see large overlap, double-check your parameter values or segment conditions.
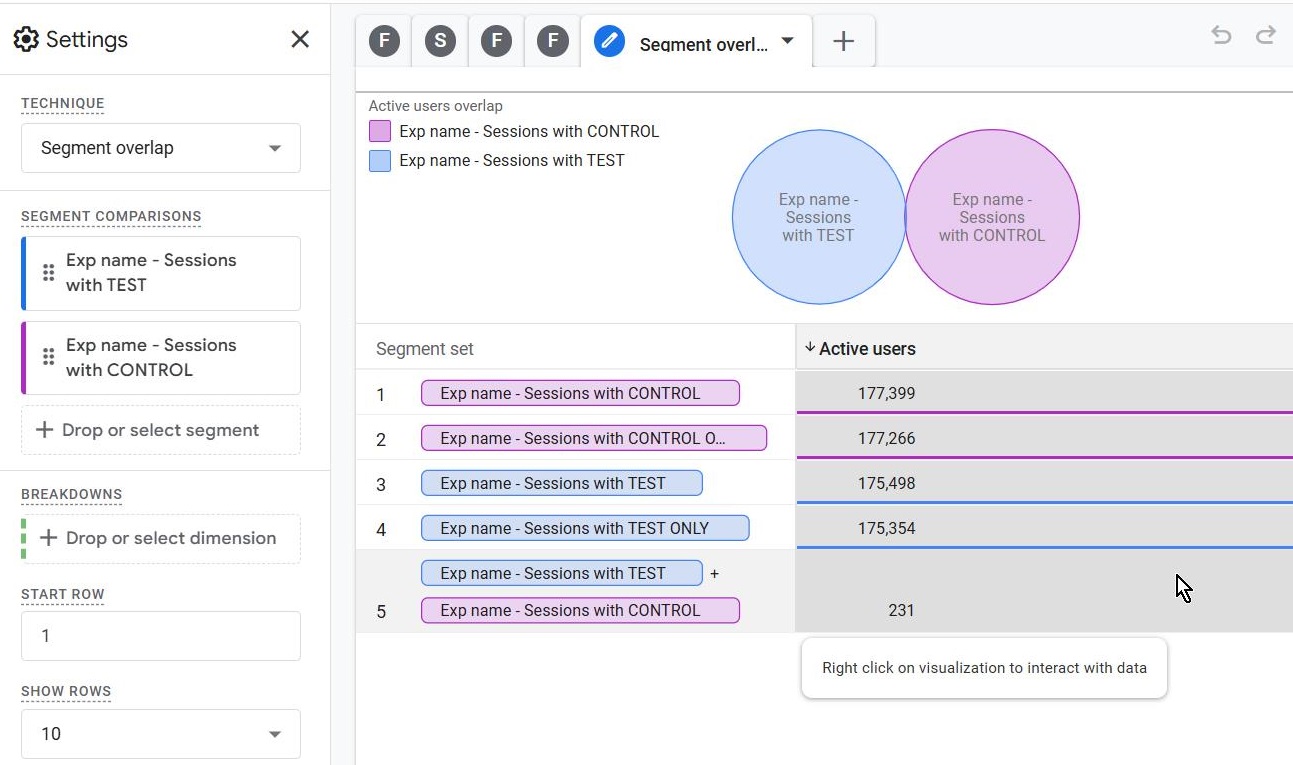
Step 5: Create a comparison in Free Form Exploration
Now we compare the test vs control groups on two key metrics:
-
Sessions
-
Purchases
GA4 will show the two groups side-by-side, allowing you to analyze differences in performance.
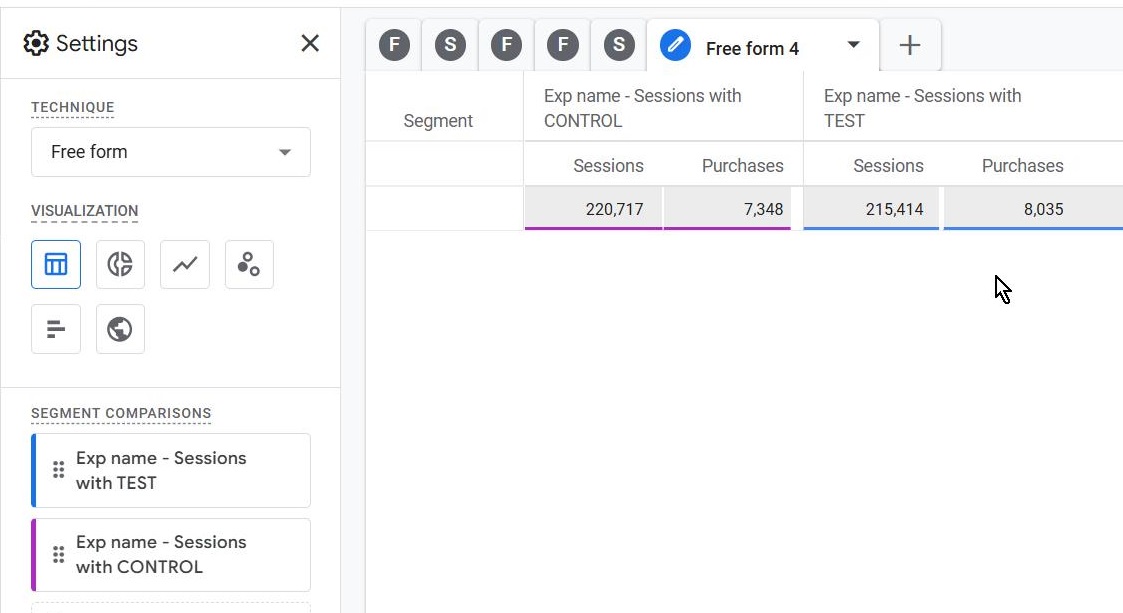
But how can we determine was this test successful? i.e is the difference statistically significant?
Step 6: Check statistical significance
We’re gonna ask AI if the variation in the outcomes represents a meaningful change in user behavior.
Prompt example:
“We ran an AB test on our ecommerce store. The test group had [your number here] sessions and [your number here] purchases; the control group had [your number here] sessions and [your number here] purchases. Was the test statistically significant?”
Lean back and let the AI guide your interpretation!
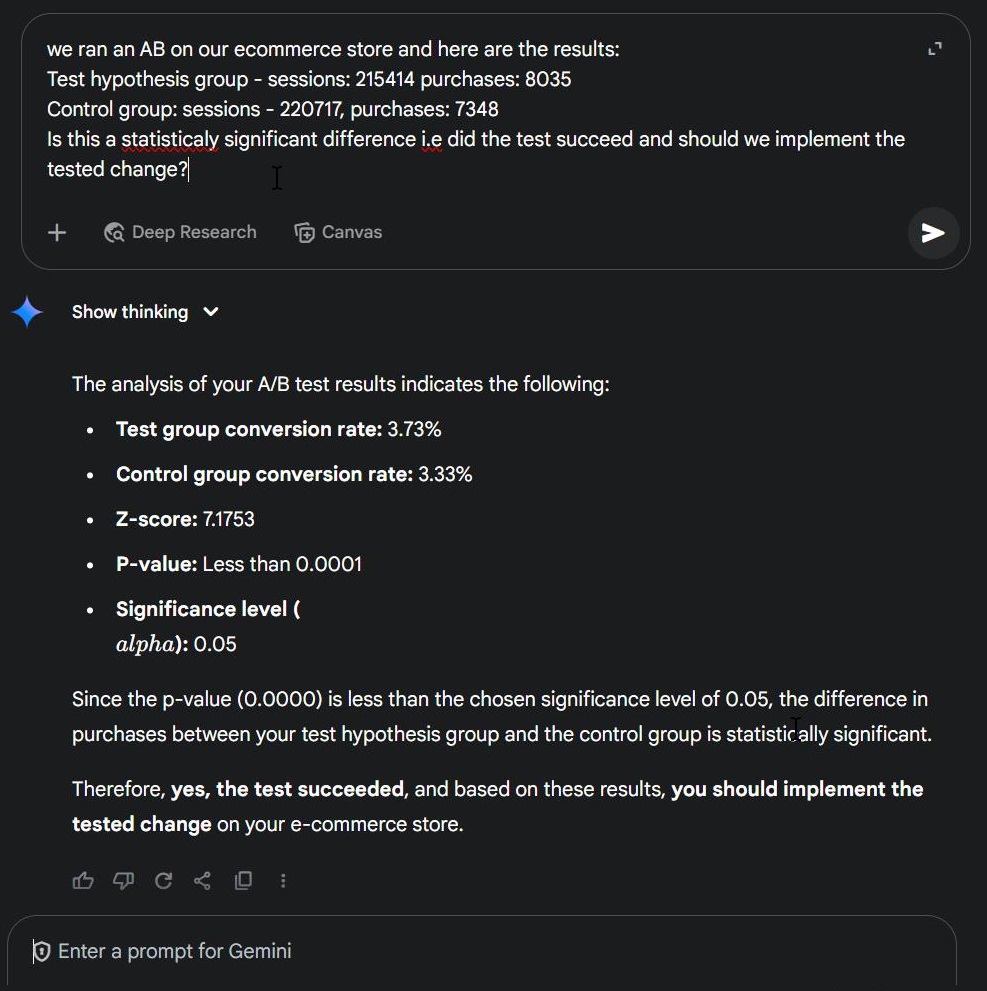
The verdict from Gemini: Test succeeded!
Step 7: Go deeper - compare revenue and engagement
To go beyond conversions:
Add Average Revenue Per User (ARPU) and Average Purchase Revenue (= AOV) to your table
Compare the values between test and control:
Pivot the table around first row for better visibility

You may find that while AOV (in GA4 it's called Average purchase revenue) is similar, the ARPU is higher for control group - a crucial insight, that you can also pull through an AI statistic analysis.
Now let’s examine how item-scoped metrics vary based on the tested hypothesis (items viewed, added, purchased)

See how Test group came out stronger for both Add-to-cart events and purchases, although it had less sessions?
We can also investigate Engagement metrics (engaged sessions, engagement rate, user engagement)

This paints a fuller picture of how users behave across the test vs control variant. In this case there's almost no engagement difference between the two groups - but we wouldn't know it if we haven't tested, would we?
Why Littledata matters?
If your purchases and revenue data are under-reported in GA4, all your insights can be misleading!
A difference as tiny as 5 - 10% in tracked conversions can shift your test results. This is especially dangerous in tests with tie-breaker outcomes - subtle improvements in data accuracy matter a lot.
With Littledata you can be sure that:
-
100% of your Shopify purchases/revenue is sent to GA4
-
All events are matched with session data i.e segments are reliable
Without this, you risk false positives or false negatives which could lead you to implement the wrong design or leave money on the table.
Final thoughts
Whether you’re using Shoplift or another AB testing tool, this approach in GA4 powered by complete tracking from Littledata will help you make data-backed decisions.
Try it for your next test, and let us know how it went.