GA4 Explorations for Ecommerce: A Complete Guide
What are GA4 Explorations?
One of the keys to ecommerce growth today is answering strategic questions using your website analytics. In Google Analytics 4 (GA4), the most powerful tool for pulling specific insights out of your data is called Explorations.
Explorations are an advanced reporting toolbox designed to provide deeper and more granular insight into data than the standard reports. Unlike high-level summaries from standard reports, Explorations allow you to quickly answer specific questions by looking into the event-level and user-level data.
How to use GA4 explorations
We recommend that you start in a blank exploration:
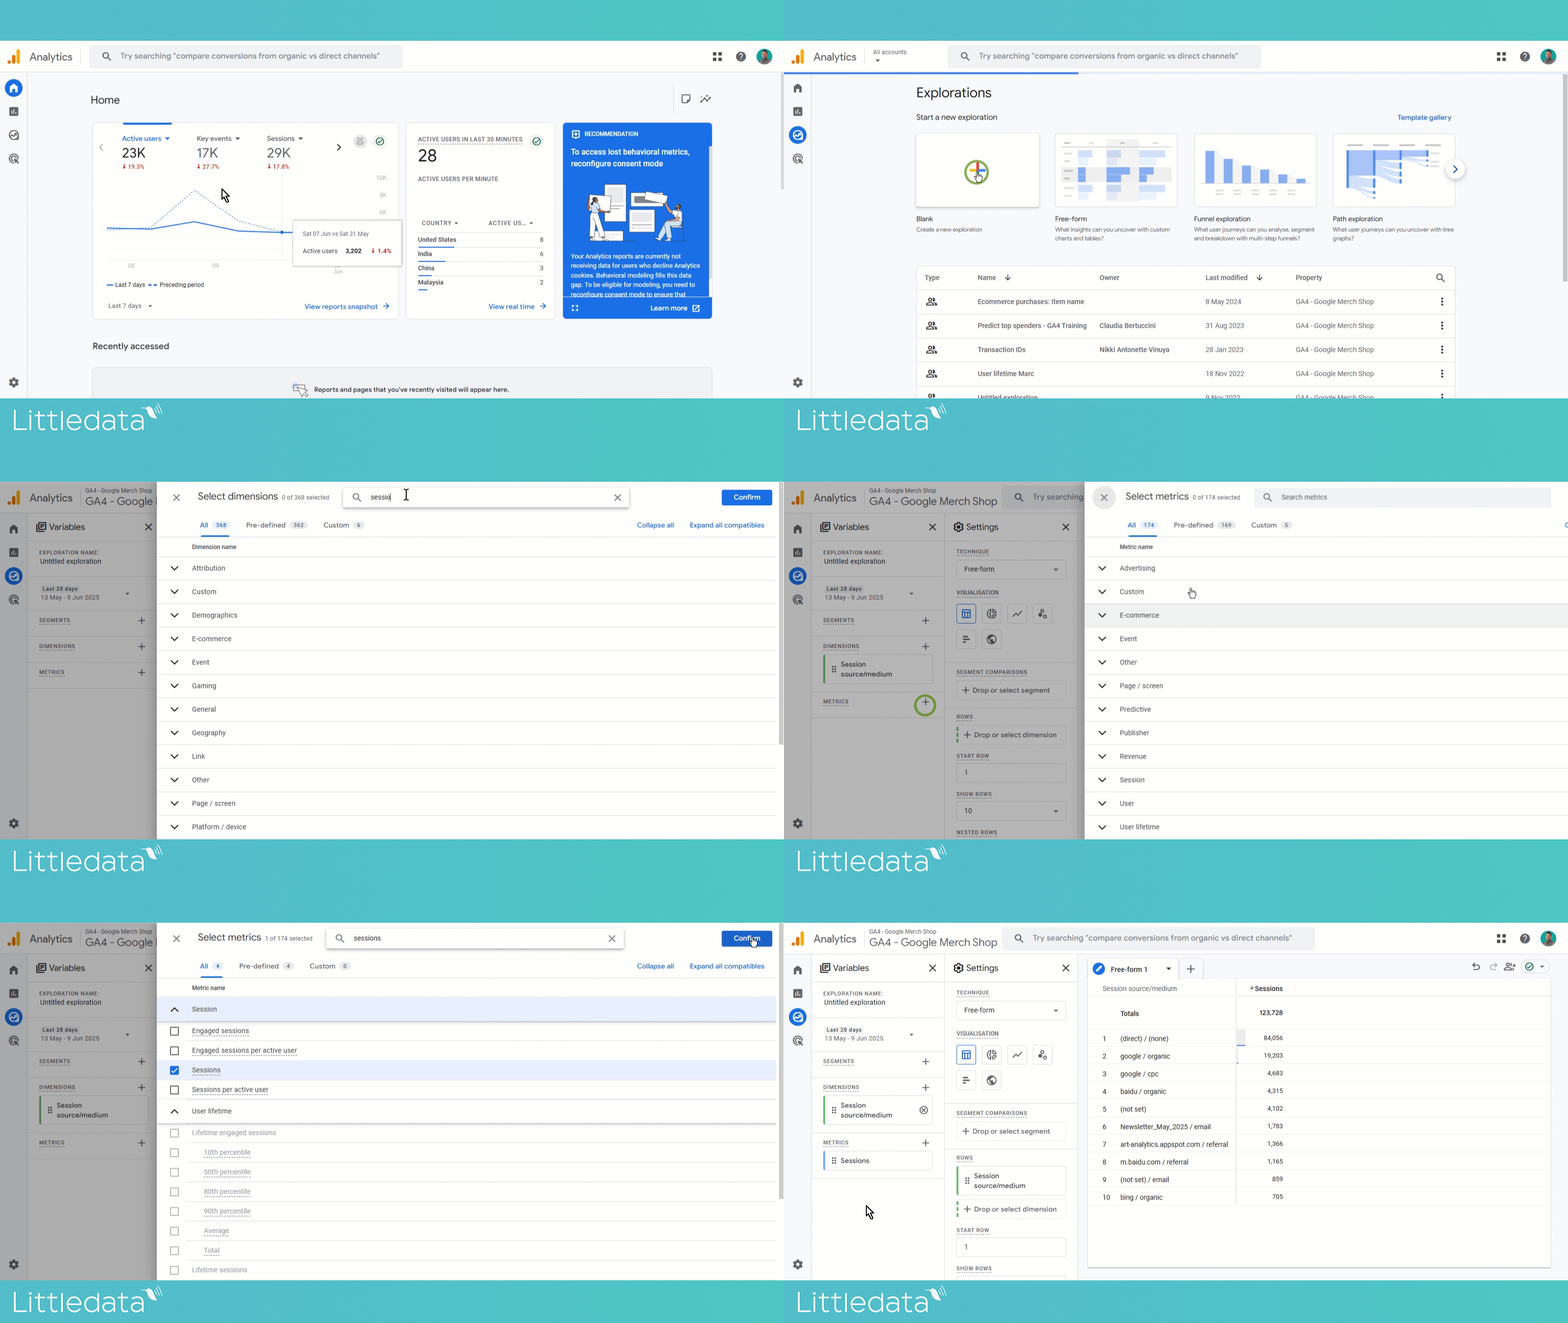
If you open the Google Merchandise Store or your own property, you won’t see a list of explorations like the one above. That’s because these are personal workspaces - created to answer specific questions.
Explorations are private - until you share them, no-one sees what you have been doing!
You can not break anything, you can not delete or compromise data in any way - so you’re free to play and poke around as much as you want. Let’s get familiar with the UI first:
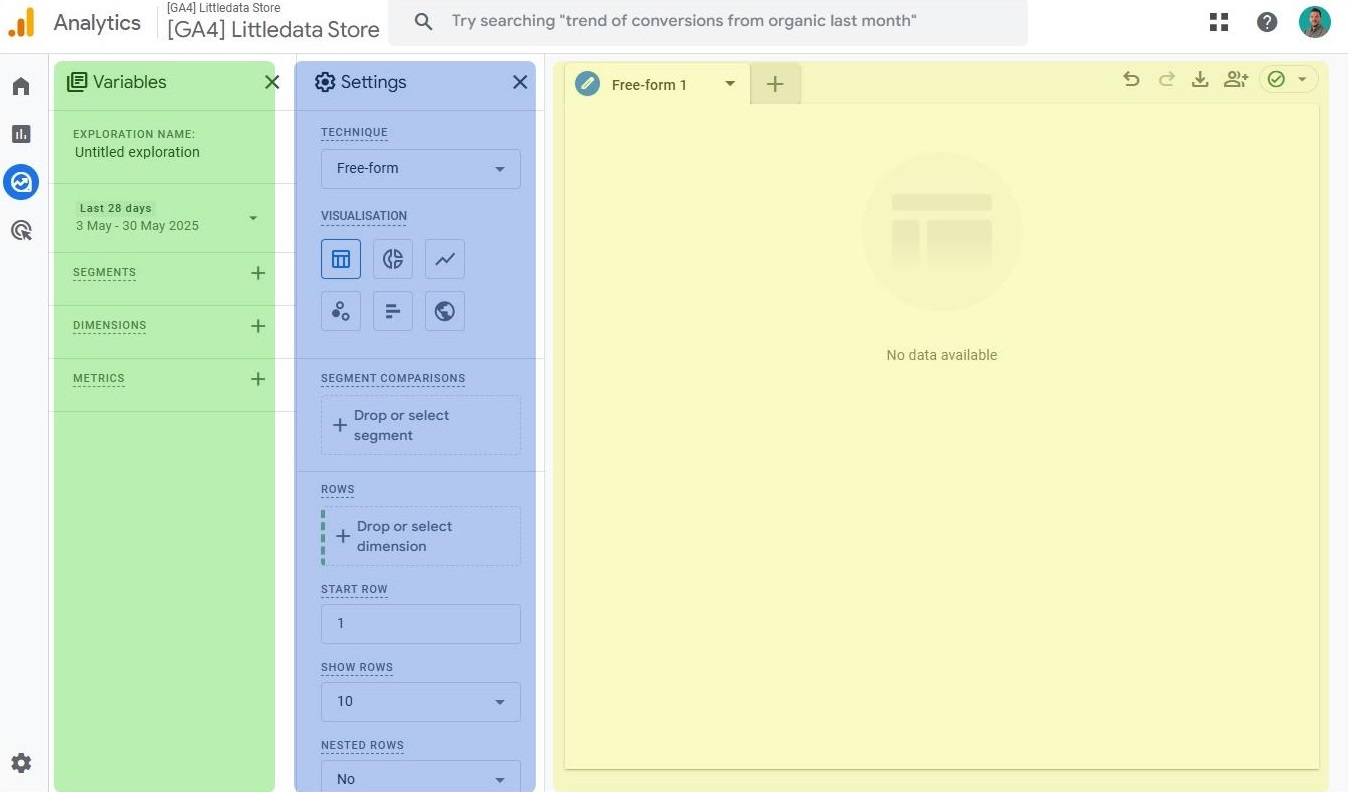
Variables panel (green) is where you choose the date range and add segments, dimensions and metrics that you will use. Keep in mind that adding those to variables only makes them available, in order to apply them, you can double-click them or drag/drop them into…
Settings panel (blue) that’s where you choose format, you see which segments, dimensions and metrics are applied, choose applicable features (such as pivoting a table, number of rows, open/close funnel etc - more on this later), define filters
The main panel (yellow) is where you see the data you "queried" - depending on the format and visualization you selected.
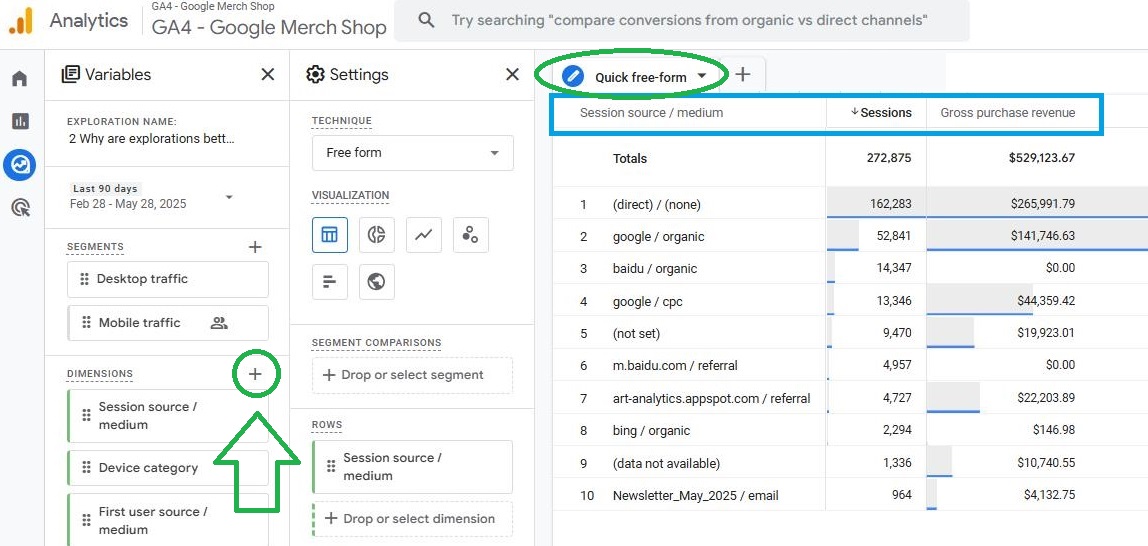
In the 1st example, we are showing you “session source/medium” as a dimension and “Gross purchase revenue” as a metric. We added them first by clicking on the plus sign in the Variables tab. Once you add them to Variables just double-click on a dimension and/or metrics and they will appear in your table.
As we mentioned previously you’ll operate within two sections: variables and settings. In Variables, you can change the date range, add/remove the dimensions, metrics and segments to have them “at-hand” so you can put them into the report itself. In the Settings tab you choose the type, visualization, select and order dimensions and metrics, add filters (need to scroll, not visible in the screenshot, we'll cover them in detail later in the text) or apply columns as secondary dimensions.
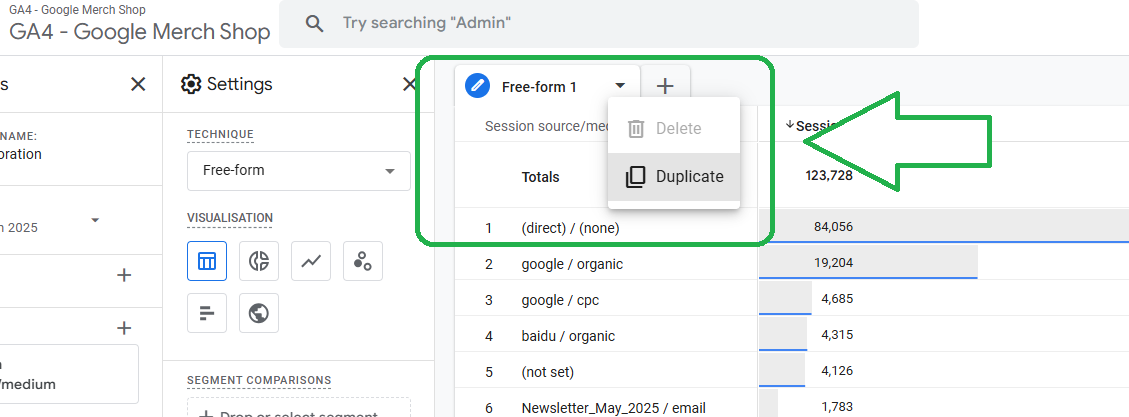
After creating your 1st tab - name it accordingly and duplicate it to further investigate (from the dropdown by the tab name). You can have as many as 10 tabs side-by-side.
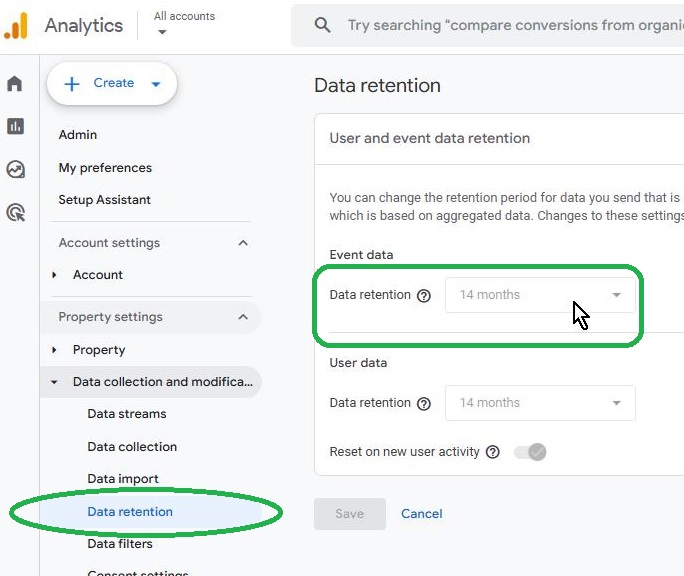
Make sure your data retention is set to 14 months (default is 2 months). Go to admin panel NOW and check this to avoid remorse in the future ⬇️
Why are GA4 Explorations better than standard GA4 reports?
We’ve already seen how easy it is to create a quick table showing sessions and revenue split by channel. Now we’ll show you the key advantage Explorations have over standard reports: versatility!
The Free-form explorations allow you to display your data using various visualizations:
- tables
- donut charts
- line charts
- scatterplots
- bar charts
- geo maps
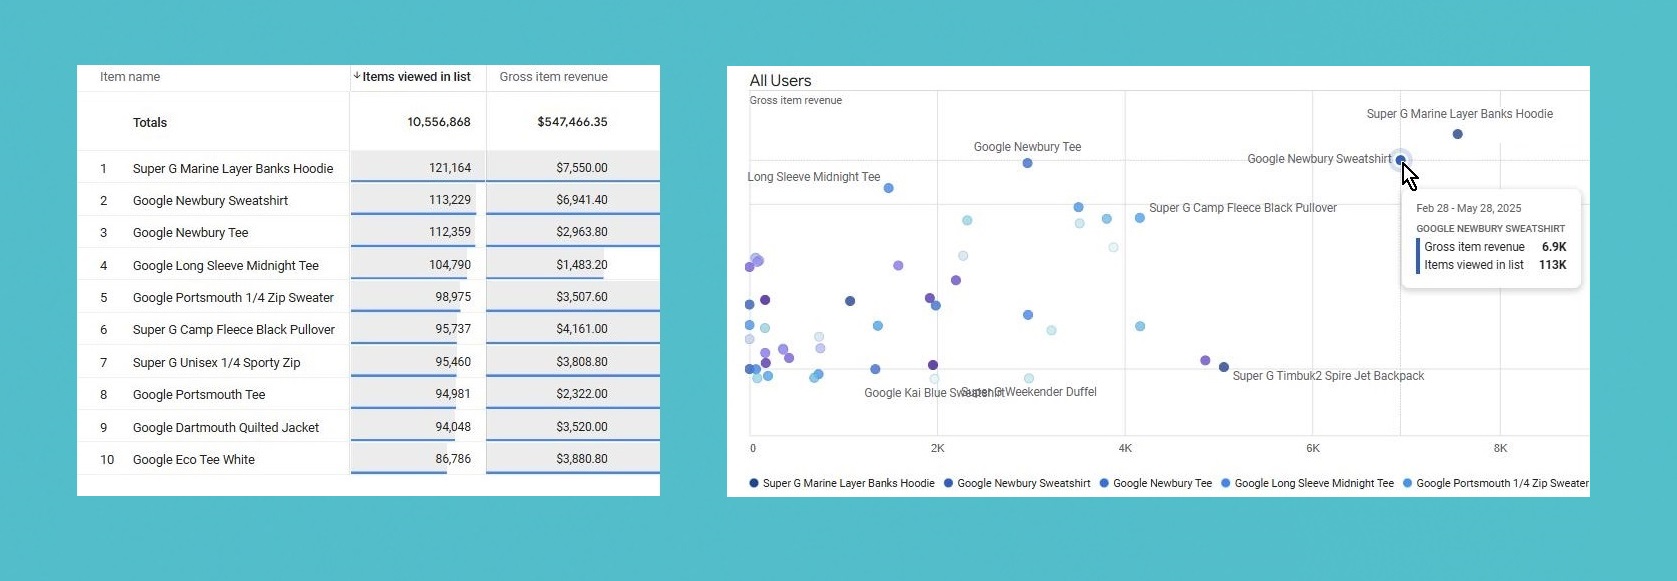
Once you choose dimensions and metrics (and segments if needed) you should experiment with different visual options: for example switch two-column item table “viewed vs revenue” to scatter plot exploration to make trends more intuitive—like seeing which product is viewed most vs. which generates more revenue.
Using filters in GA4 Explorations
Another huge benefit of GA4 explorations is FILTERING:
In the settings panel, you can filter out certain source/medium combinations. For instance, remove anything that contains “not” (e.g. “not set”) or “direct / none”.
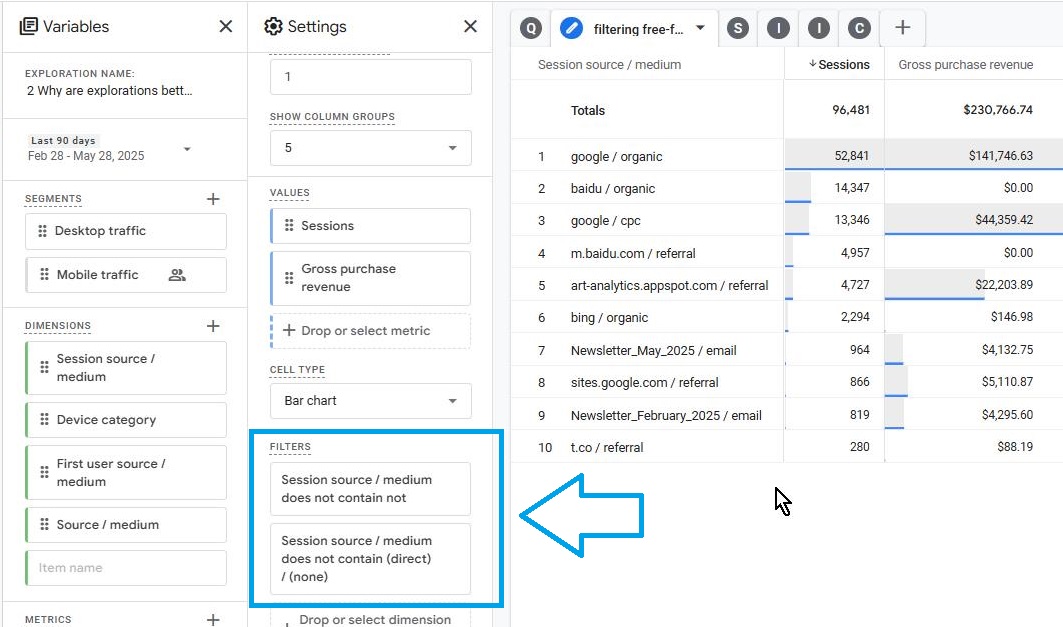
You can add multiple filters for the same dimension - something not possible in standard GA4 reports
Segments: explore the difference in revenue between desktop and mobile traffic. You’ll see that although mobile may have more sessions, desktop might drive significantly more revenue.

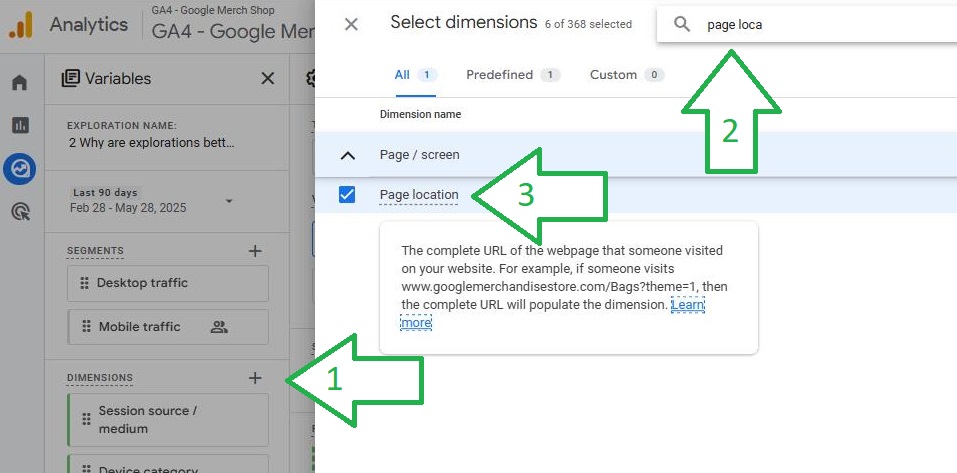
Raw data: automatically tracked parameters (like page location) that are unavailable in standard reports are accessible in Explorations.
Which GA4 Explorations are most effective for ecommerce?
Simple answer: all of them - segmentation, filtering, comparing cohorts, geo maps visualization, lifetime value… you name it. With absolutely no intention of stopping you to try each one of them (and see how great they are!) let’s break down a few most common ones:
Free-form exploration is the default when opening a new Exploration. You can mix and match dimensions and metrics: for example, combine “session source/medium” with “landing page,” “engagement rate,” “average revenue per user,” and “total users.”
This lets you answer questions like: How do users from Google Organic who land on the home page perform vs. those from Google CPC sent to a specific category page?
You’ll be able to sort and compare total users and revenue per user for each channel.
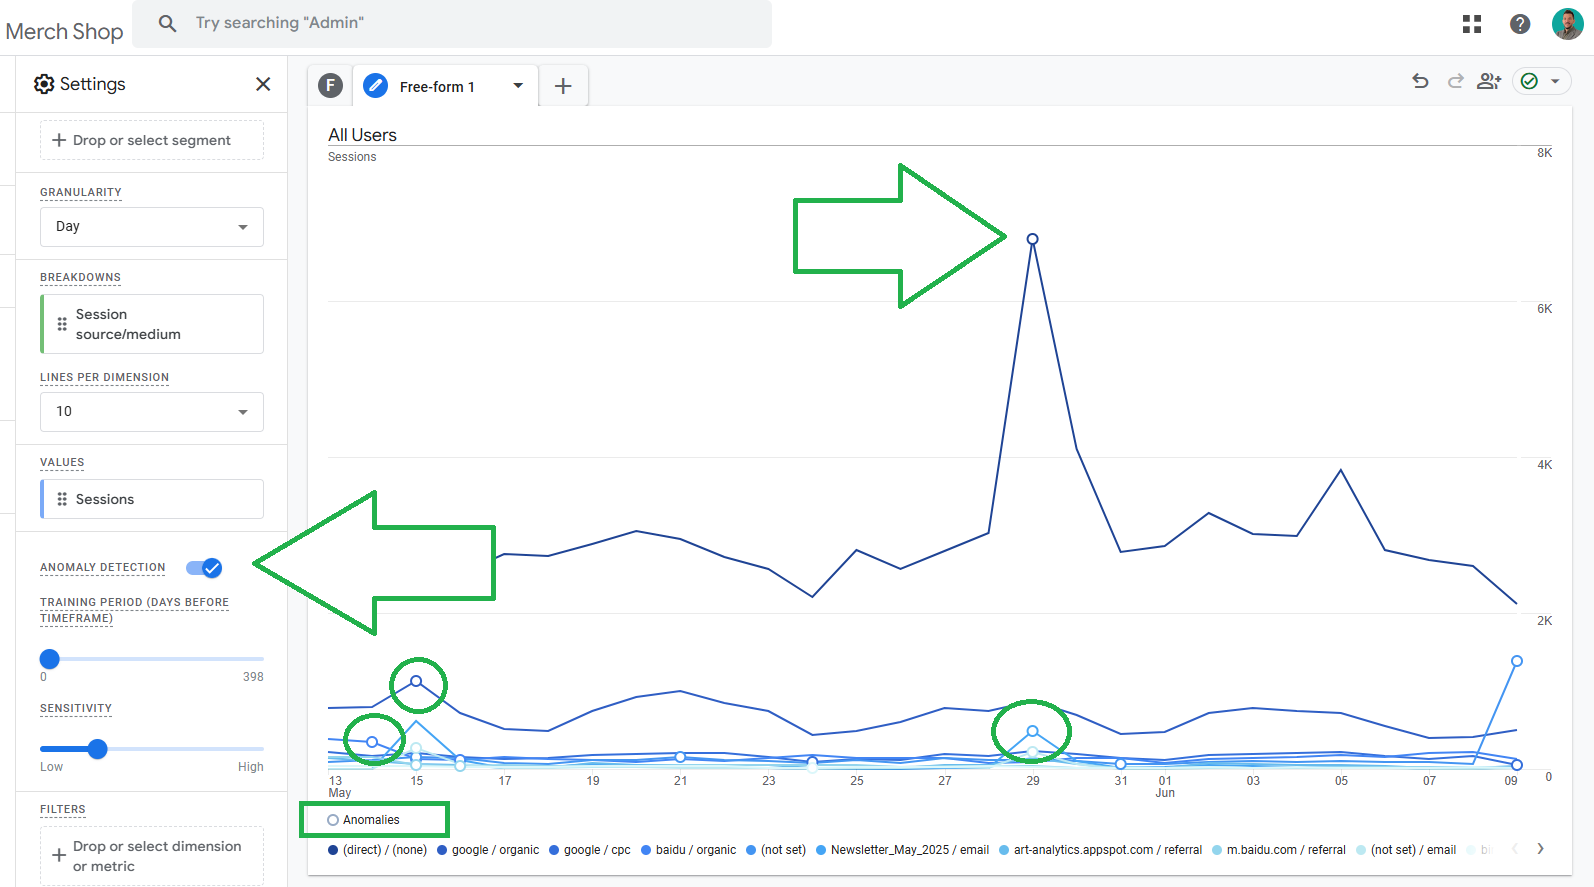
Anomaly detection switch in the Settings panel helps you quickly identify where expected values get “derailed” - by sparing you from doing statistical analysis - i.e performing it on your behalf, under the hood.
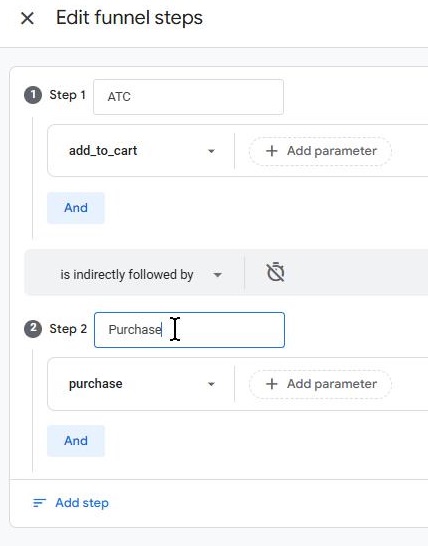
Funnel exploration visually represents the steps users take to complete a specific task, providing easy insights into their success or failure at each step. As such, funnel explorations require you to put in at least two steps. In the following example it’s the trivial combo: Step 1 – “Add to Cart,” Step 2 – “Purchase.”
Add a breakdown by any dimension of your choice and you can observe differences in how visitors with unique dimensions progress through the funnel. In our case we “broke the funnel down” by country:
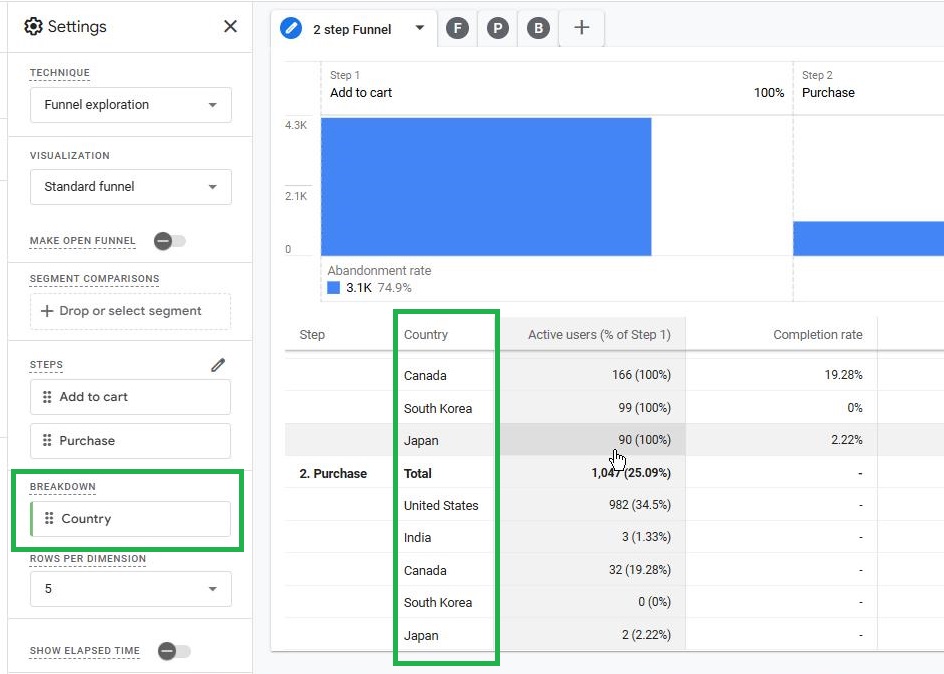
Important caveat: The dimension in the first step (in this case country) propagates throughout the funnel, even if performance differs later (e.g Japan vs S.Korea). Interested to learn more? We have an article that covers GA4 funnels comprehensively.
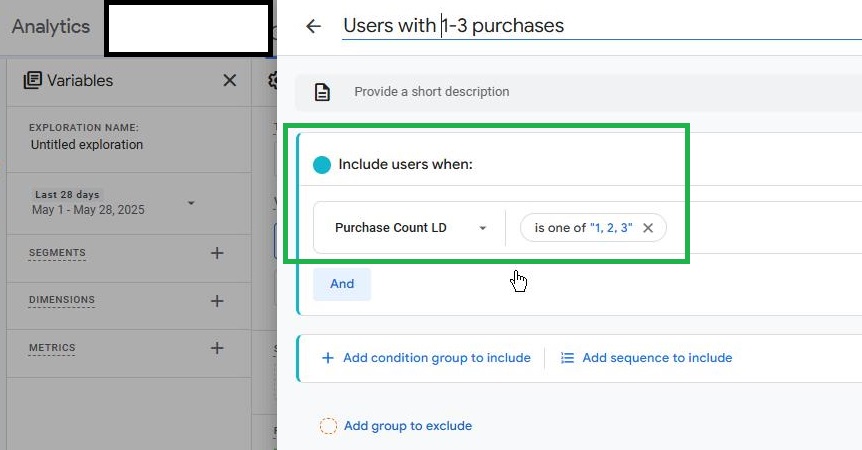
Segments represent grouping Users, sessions or events by conditions you get to choose. They can be predefined or custom-built for any comparison you can think of. In the following example we are going to build three different segments based off of a Littledata custom parameter that counts how many times each buyer purchased:
-
Segment 1: users with 1–3 purchases
-
Segment 2: users with 4–6 purchases
-
Segment 3: users with 7+ purchases
Add metrics like session count, revenue per session, and average revenue per paying user to compare performance across user groups.
Pivot the table around the first row to improve readability by having segments appear as dimensions

For a more detailed guide on how to segment your customers based on number of (recurring) purchases they had watch the following video:
Free-Form Explorations to identify top-performing products and categories
Free-form Exploration is the default and most versatile technique within GA4 Explorations, offering a highly customizable and flexible environment to analyze sales data, product performance, and customer segments.
Let’s return to the standard ecommerce purchases report under the Monetization section. Here’s the problem: you can’t add “item category” as a dimension—it only shows “device category.” (1)
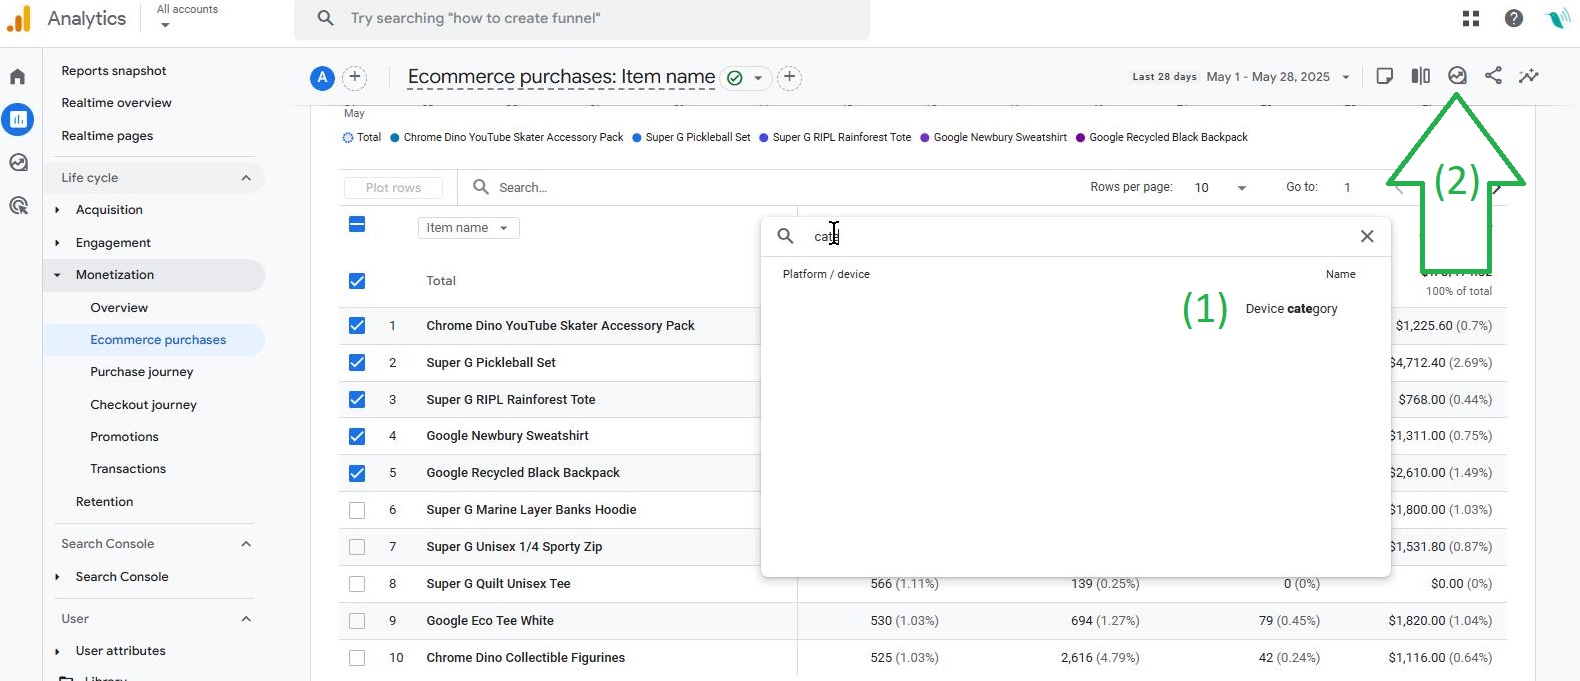
That’s where Explorations come in - click the icon (2) to open a report as an Exploration and then add “item category” because it’s an item-scoped dimension.
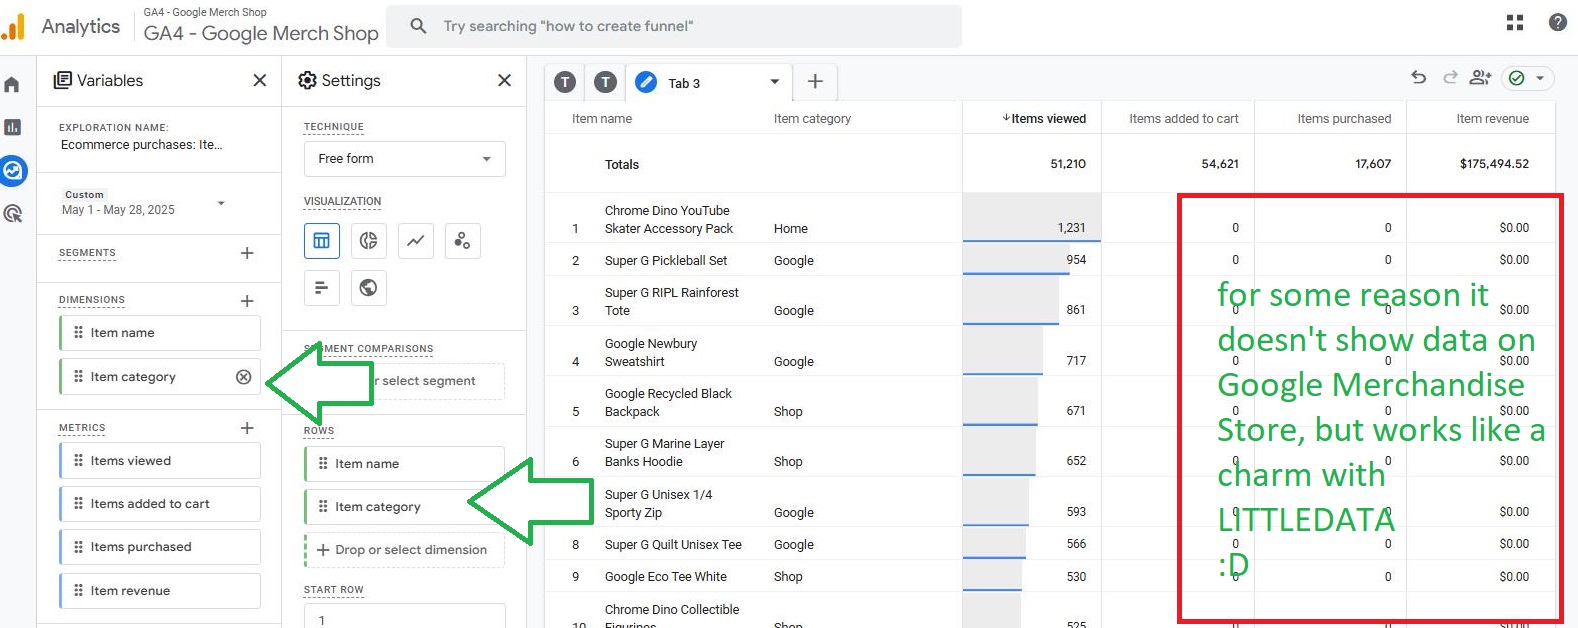
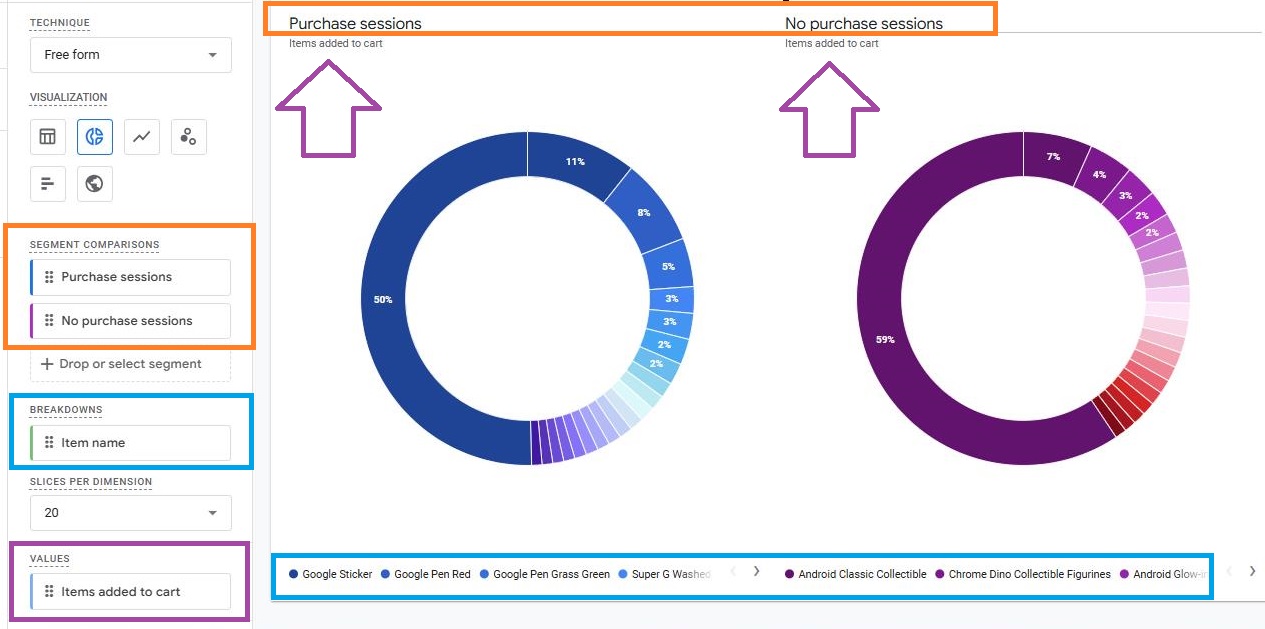
Want to dive deeper? Create two segments (more about them below!) one for sessions with a purchase another for those without - and compare products that “drive” a conversion after being seen vs those without that “superpower”.
Is it the price to blame? Is it the product photos, copy on the PDP or simply bad product-market fit?

Same segments another visual: use donut charts to analyze “add to cart” events by product. You’ll quickly see which items convert after being added to cart vs. those that don’t.
What can Funnel Explorations reveal about customer journey bottlenecks?
The core functionality of Funnel Exploration is to clearly show you what happens with users on a predefined step-by-step journey of actions.
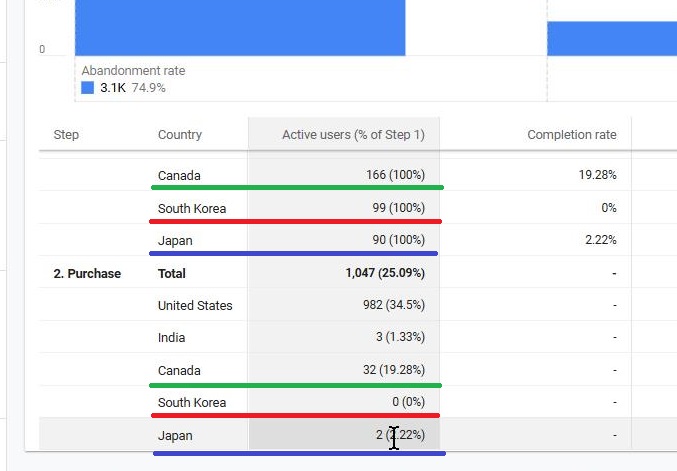
Let’s return to our simple two-step funnel example: add to cart → purchase. Do they buy after they add to cart? Although the metrics is always users (and percentage of users), the funnels have an awesome feature: you can break them down by any dimension. Let’s break this one down by country. Japan shows 2% of users convert i.e purchase, while South Korea shows none. Canada, by contrast, performs well.
Opening/closing funnel toggle helps you understand if users enter your funnel in the middle, i.e not in the step you defined as first
Now let’s add some more detail: let’s filter by product page URLs (e.g. “page path contains /product”) and apply the page path dimension to see how different entry pages affect funnel completion.
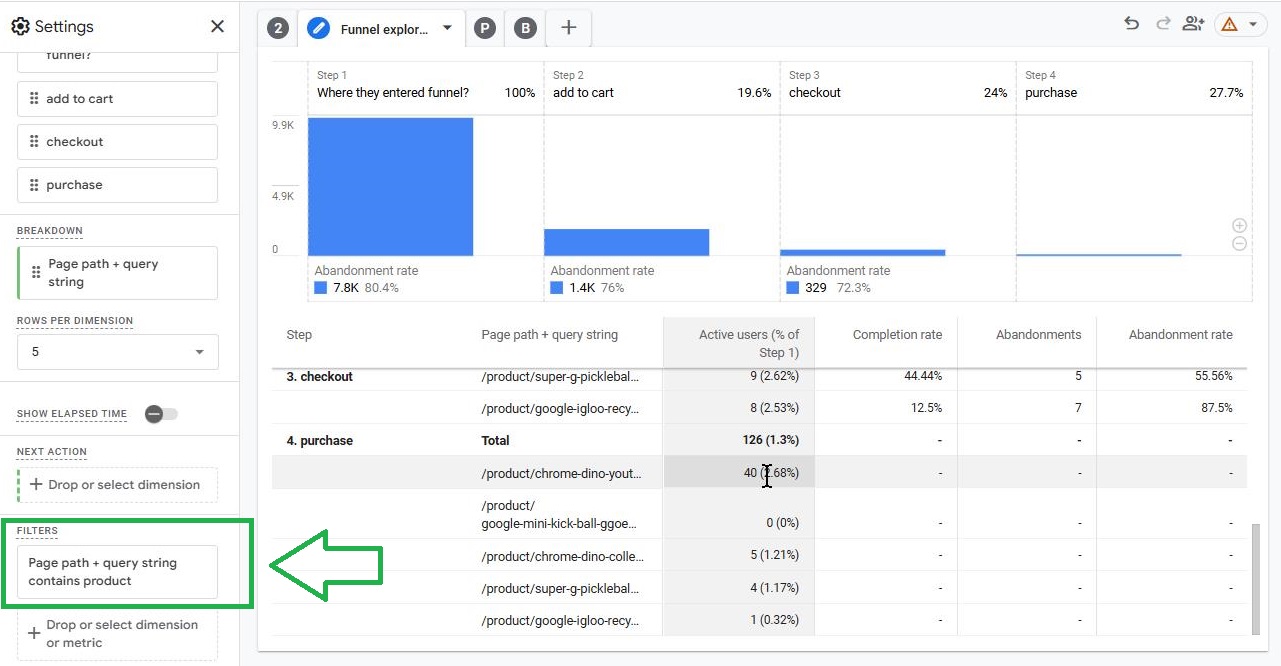
This level of detail helps pinpoint where in the journey users drop off—and which entry points are the most effective.
If you are selling subscriptions here’s how you can use GA4 funnels to measure your retention success.
How do Path Explorations help understand navigation patterns?
In the “Path” exploration type, you start with an event or page (e.g. “view item”) and branch out to see what users did next.
Want to see what happened after a particular event - in this case it’s “new_engaged_user”? Click on a node to expand the path. You can view by event name, page title, or page path. Note that you can simultaneously branch from multiple nodes.
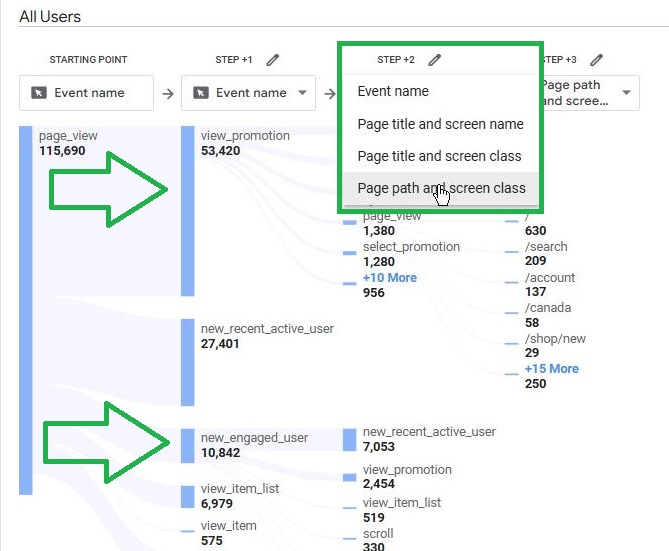
Click on “start over” in the top-right corner to choose the path’s ending point instead of a starting point to branch backwards.
In the following example we set “add to cart” as the end point of the path:
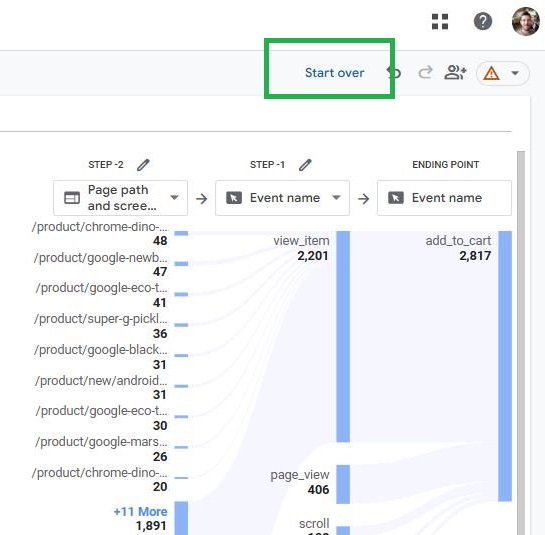
You can also apply filters based on a dimension from Variables. In the example above we’re only analyzing sessions who landed on Homepage.
How segment overlaps in Explorations improve your decision-making
By default, blank Segment Overlap explorations use session segments — not user segments — which are not overlapping by design. Always switch to user segments and add “any point in time” as a matching condition (hence the “@APIT” suffix in the segment names)
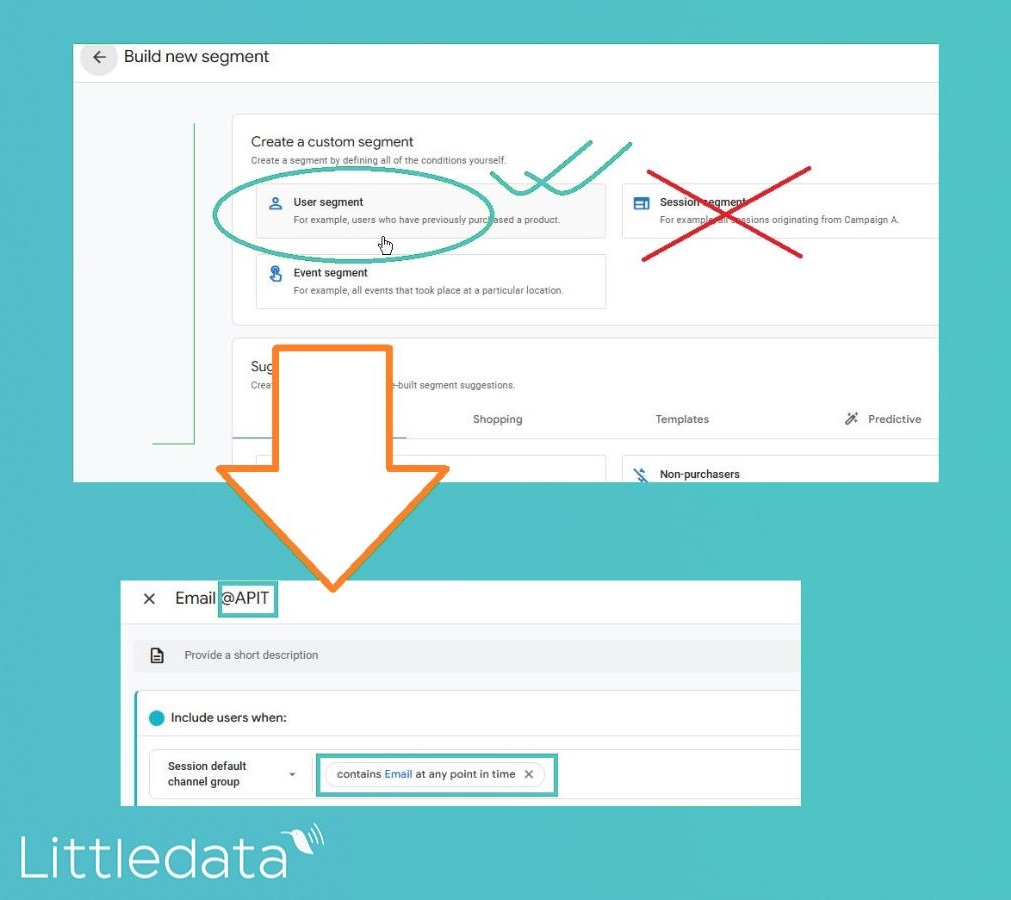
Since 3 segments are max - compare 2 user traffic segments against users who converted (can be a micro-conversion as well)
In the example below we are looking at those who arrived via “Evergreen search” campaign vs. “referral”.
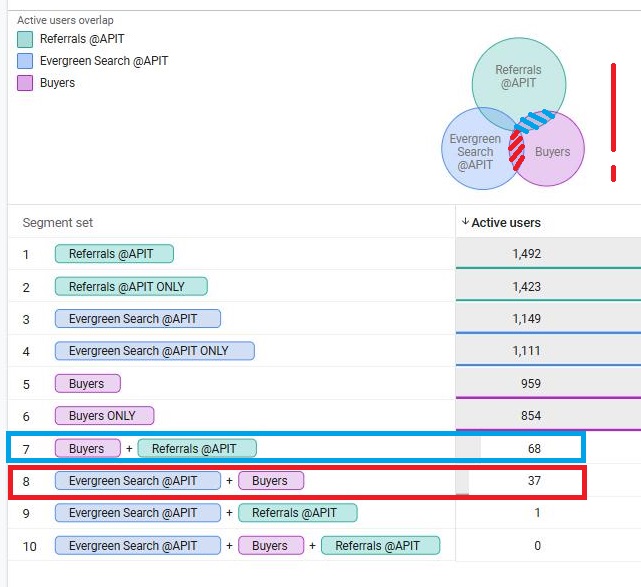
Beware that the visual representation of Venn diagrams isn’t always accurate - in the example above the overlaps of both channels with Buyer circle looks similar although the table below reports a significant difference (although 2x more for referrals). So always make sure to check the table!
When should you consider a Cohort Exploration
Cohort explorations allow you to compare how groups (cohorts) of visitors perform over time. Starting a cohort exploration begins by scrolling to the right in the explorations menu.

Once a new Cohort Exploration opens, get rid of segments. Segments make an already complex concept even more complicated!
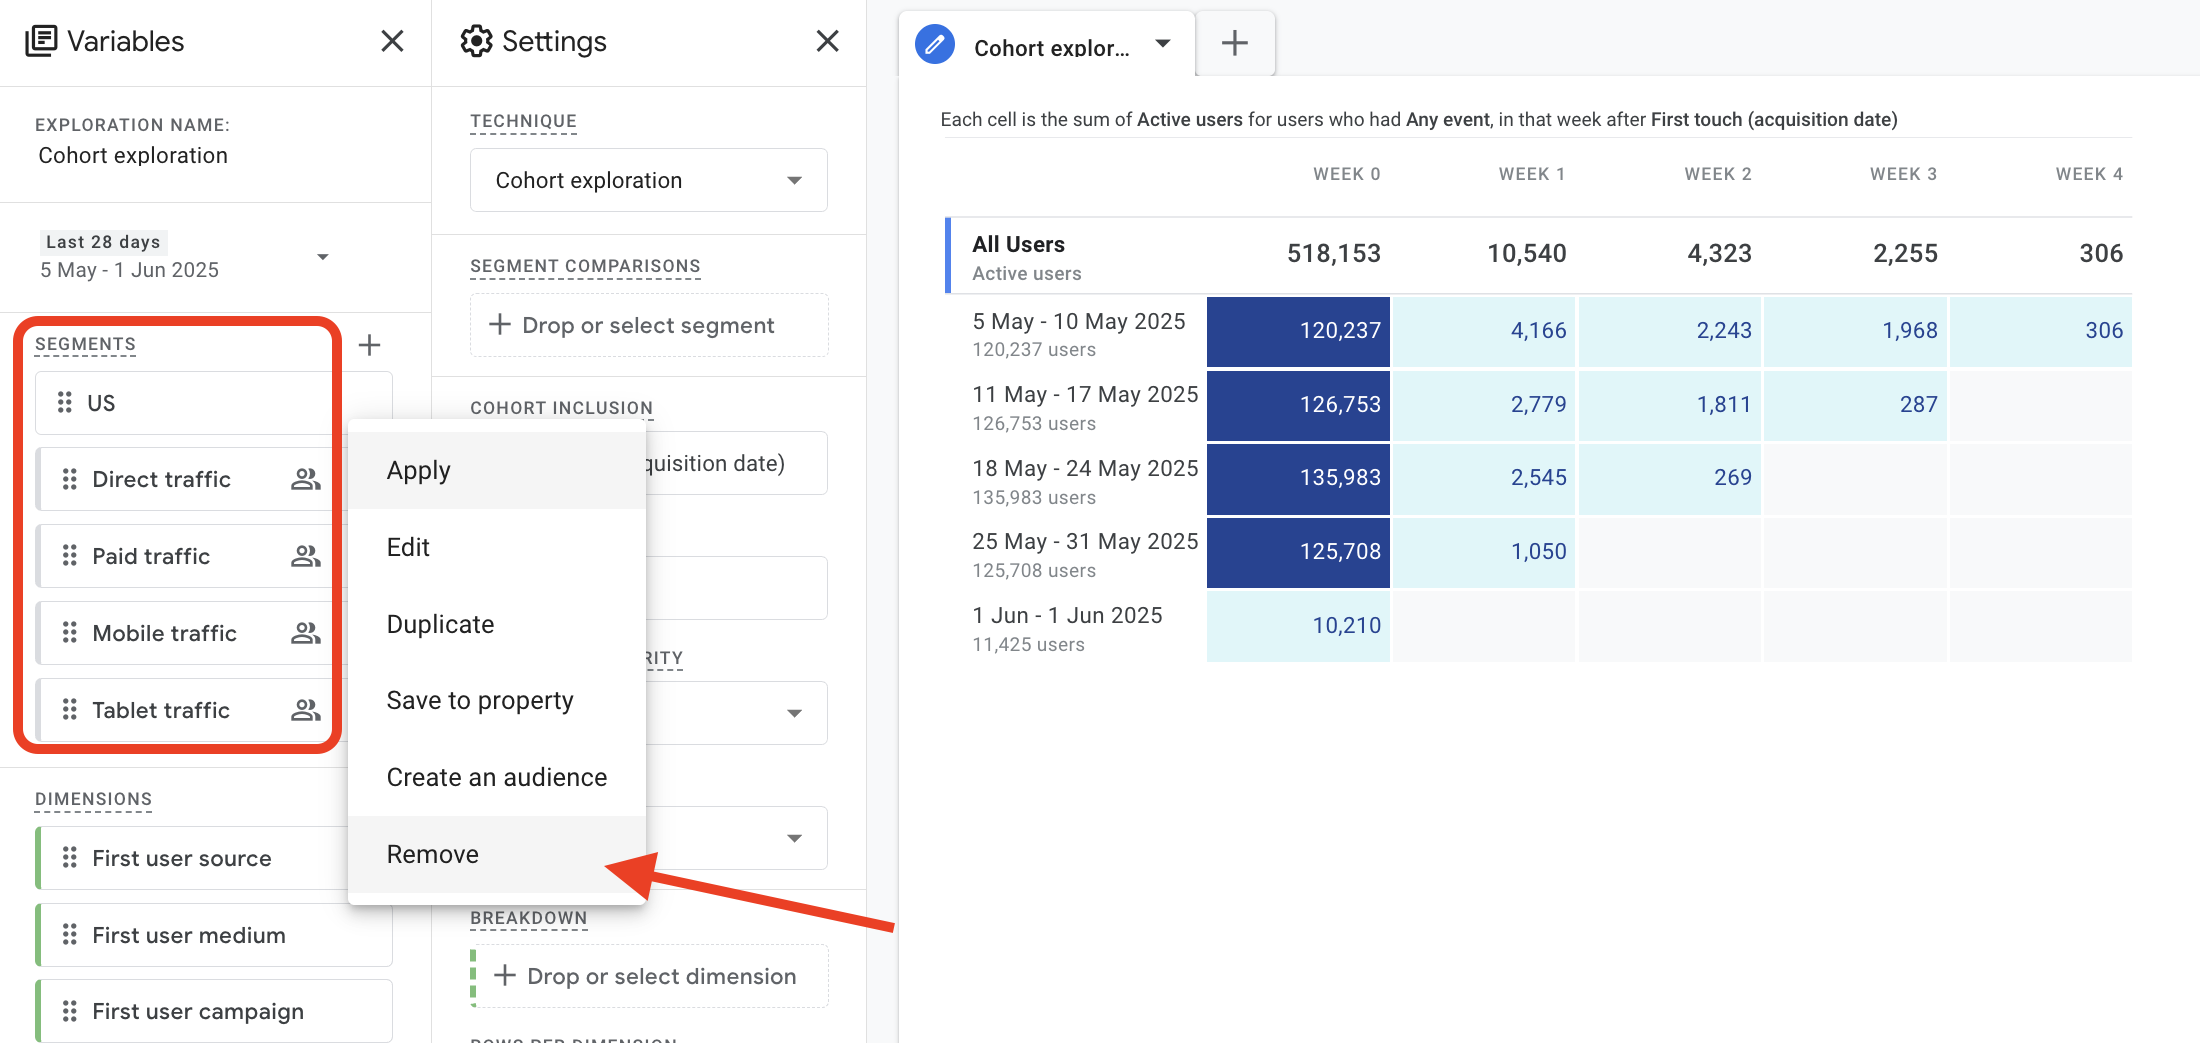
Once you grasp what Cohort explorations are all about, you’ll easily add back segments (not these random, predefined ones - but the ones that actually make sense for your business!)
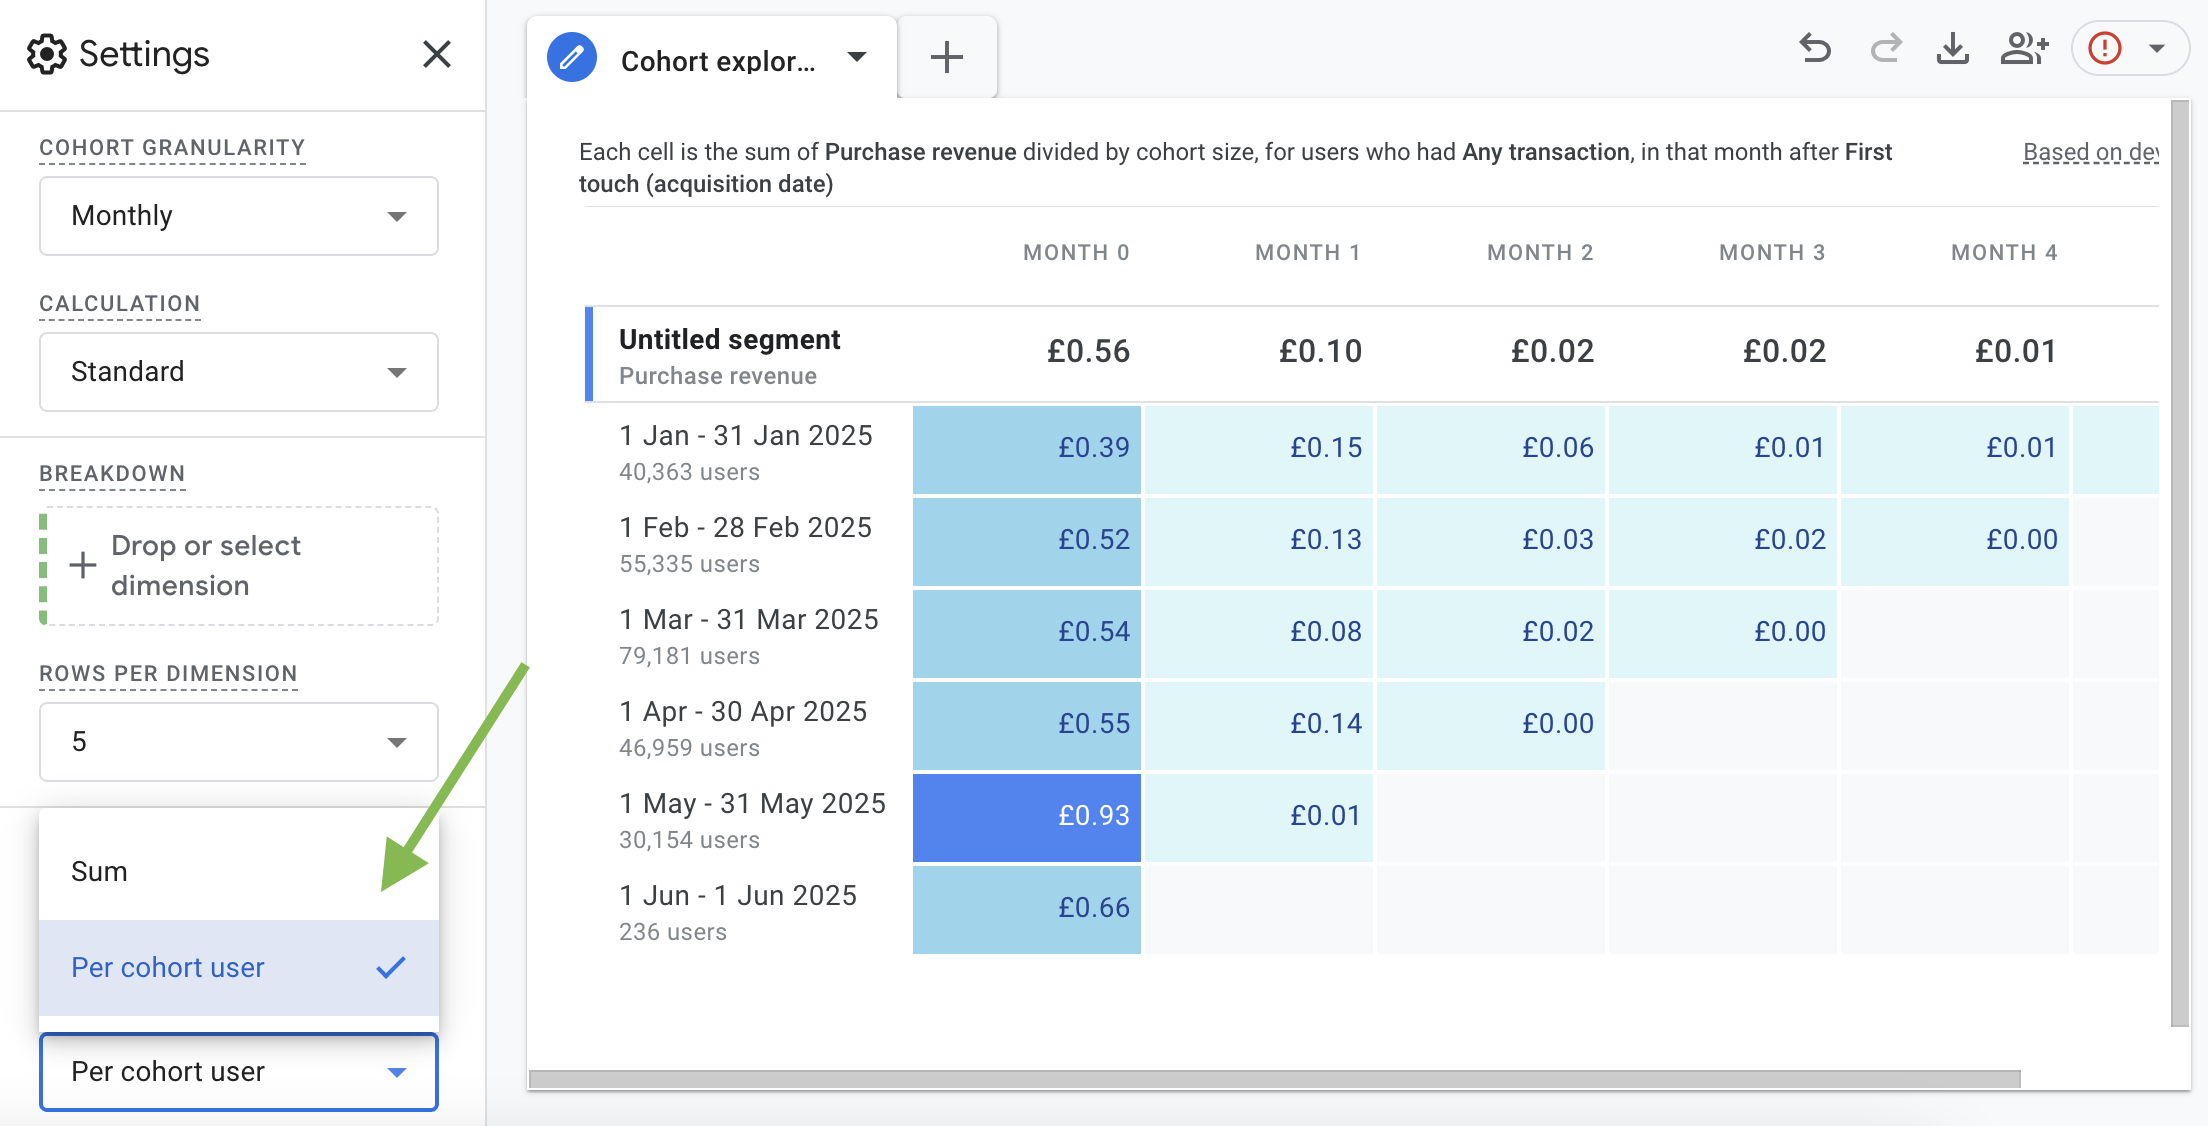
The prepopulated exploration is not very ecommerce friendly so we suggest you make a few tweaks right off the start: extend the timerange, switch “granularity” to monthly and replace “value” with Purchase revenue:
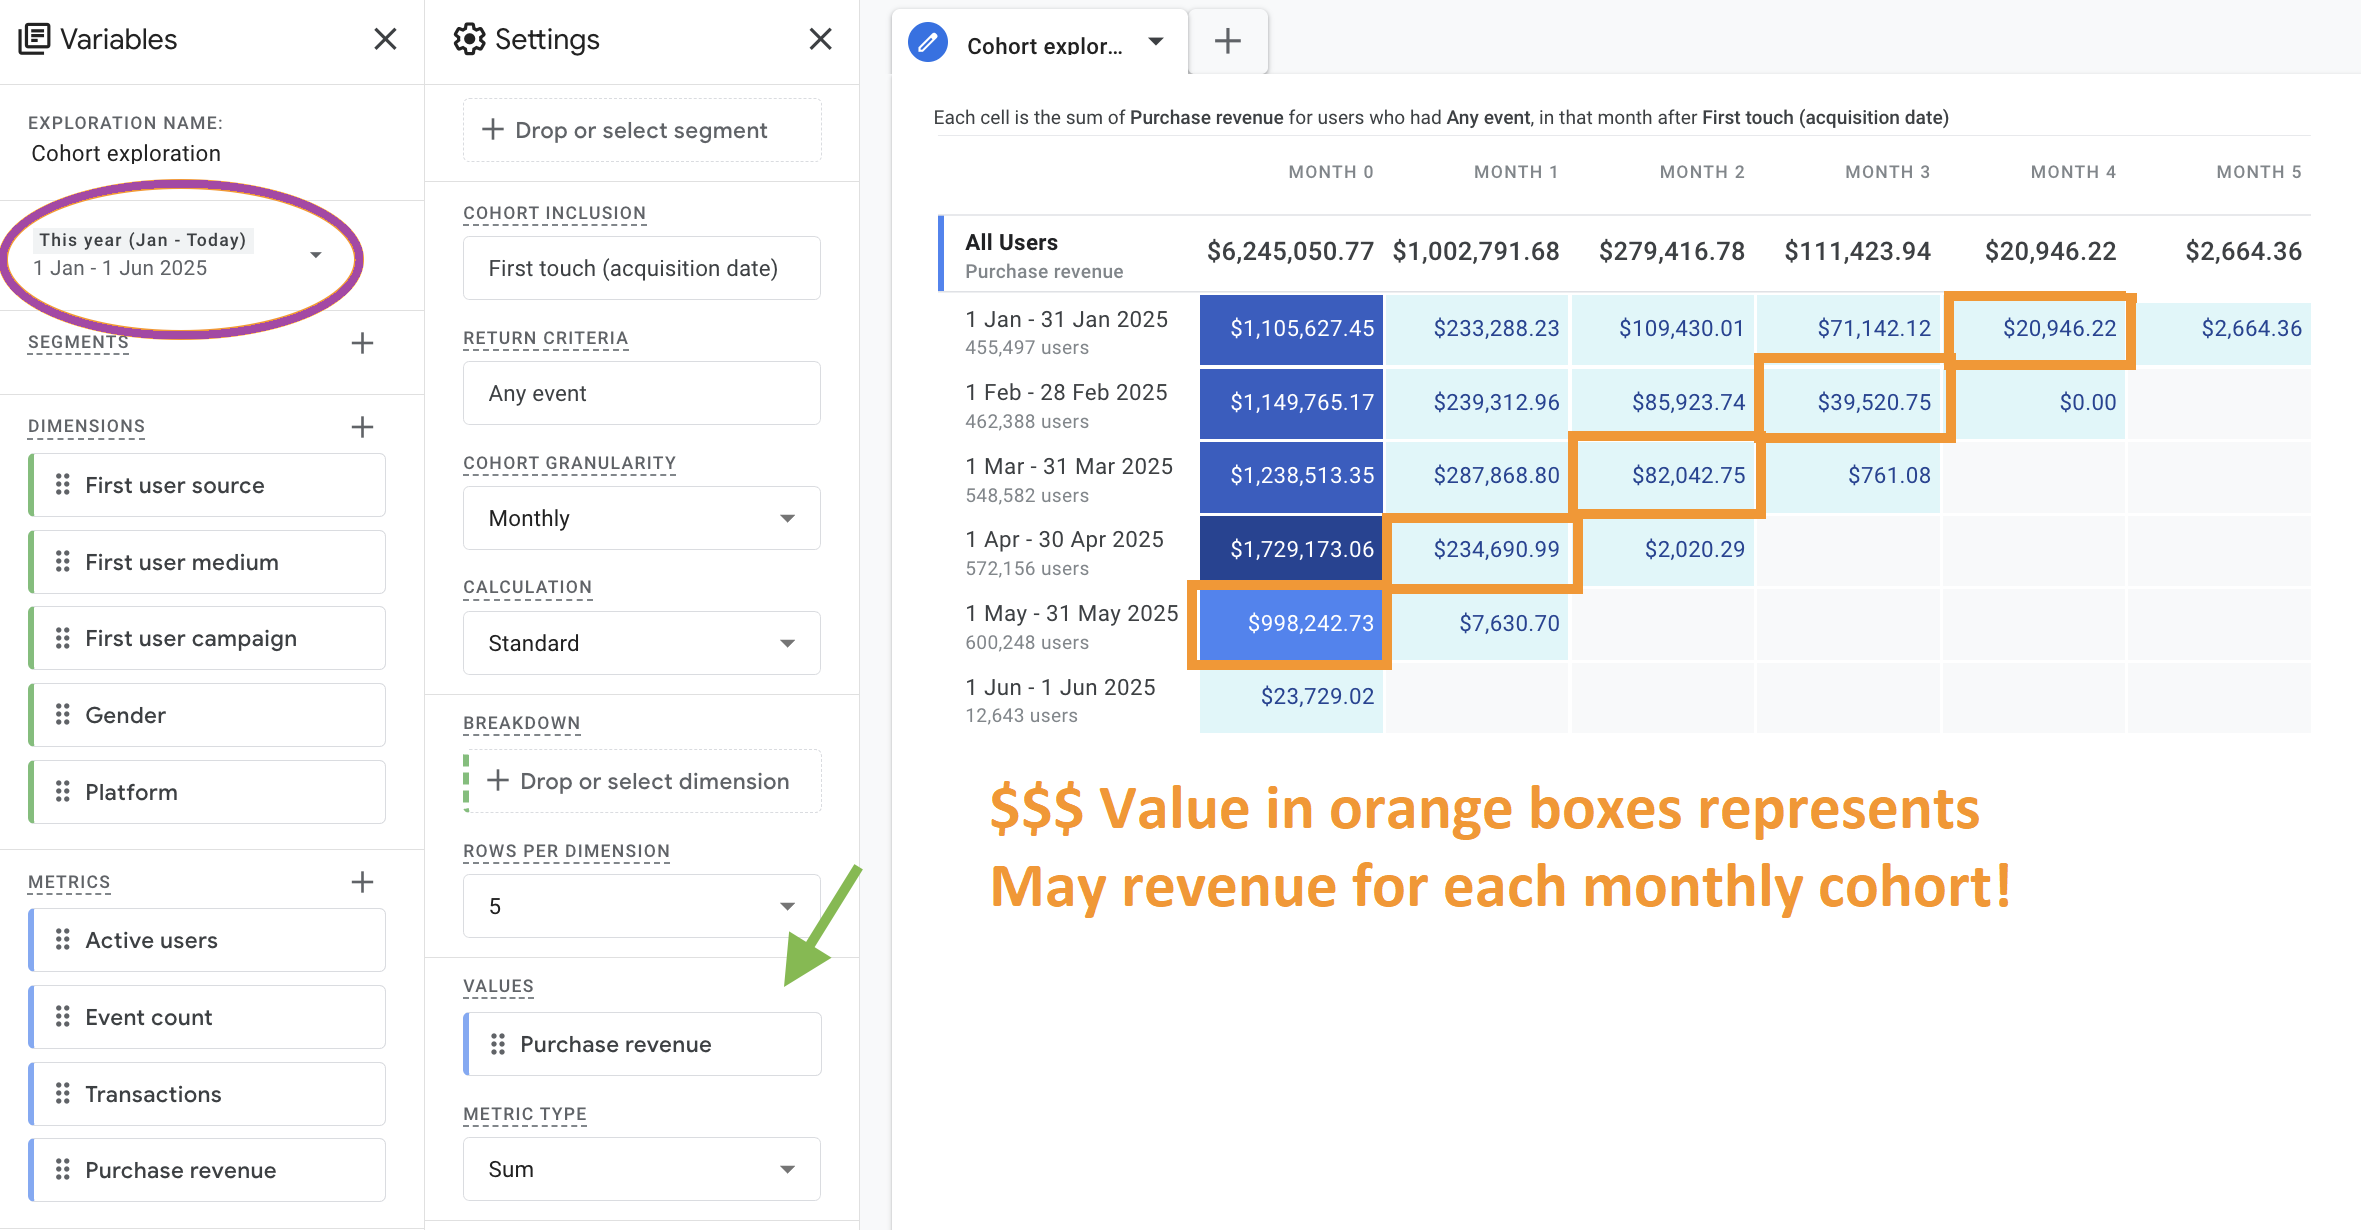
Analyzing Cohorts require changing how you look at revenue - each row represents a group of users who visited the site for the first time during a specific timerange (column 1) whereas it’s the diagonal that shows the revenue produced by different cohorts for the same period!
This exploration is very insightful and has many moving parts - add dimensions, or segments to see the level of granularity it offers.
If you get disappointed by Average Revenue Per User (ARPU) not being available . . .
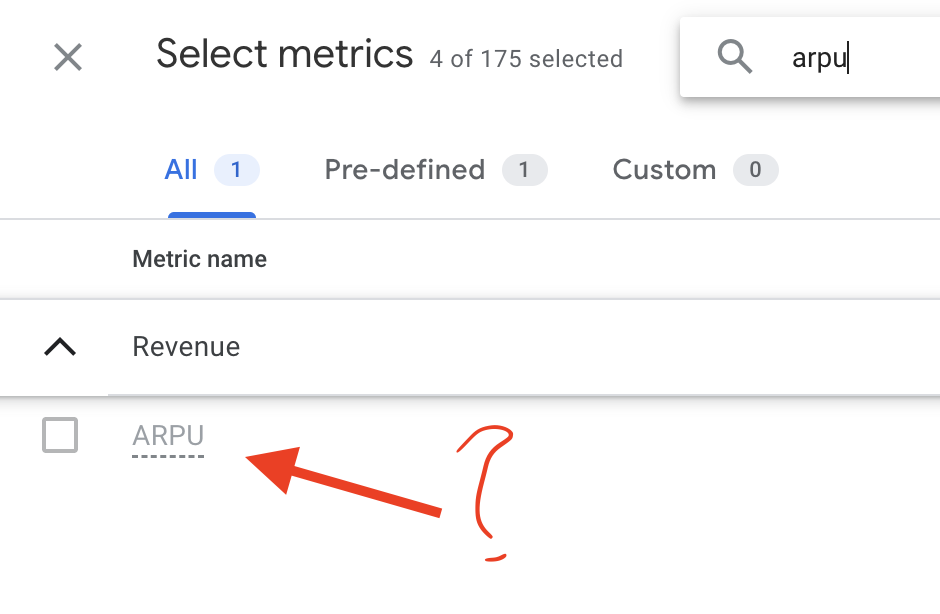
..don’t worry - simply change the Metric type (found at the bottom of Settings tab) from “Sum” to “per cohort user” and you'll be able to track the value of individual users within each cohort over time!
User Lifetime Value Explorations
User Lifetime Exploration in GA4 is an exploration designed to analyze user value based on the beginning of their customer journey, i.e. from their very first interaction with the site.
Please note that GA4's User Lifetime Value covers all users of a website split by 1st touchpoint (or last audience), not just purchasing customers, which means it includes non-spenders who significantly affect the bottom-line performance of any user group. While custom CLV dimensions (like those provided by Littledata) can track actual customer spend, GA4's native User Lifetime is tied to the selected date range, showing group performance during specific periods.
We have a separate article on Lifetime Value in GA4 with more detail.
You’ll find this exploration at the far right of the horizontal menu in the home explorations page. Let’s use “First user source,” “First user campaign,” and “First user medium” to evaluate how acquisition channels perform over time.
Add more than 2 dimensions to a free-form (not only in LTV reports but in ANY Exploration!) and try out nested rows for clarity
Be aware that “first user” dimensions relate to the first touchpoint and differ from session-level dimensions.
Compare how much lifetime value is driven based on the 1st touchpoint source/medium/campaign combo.
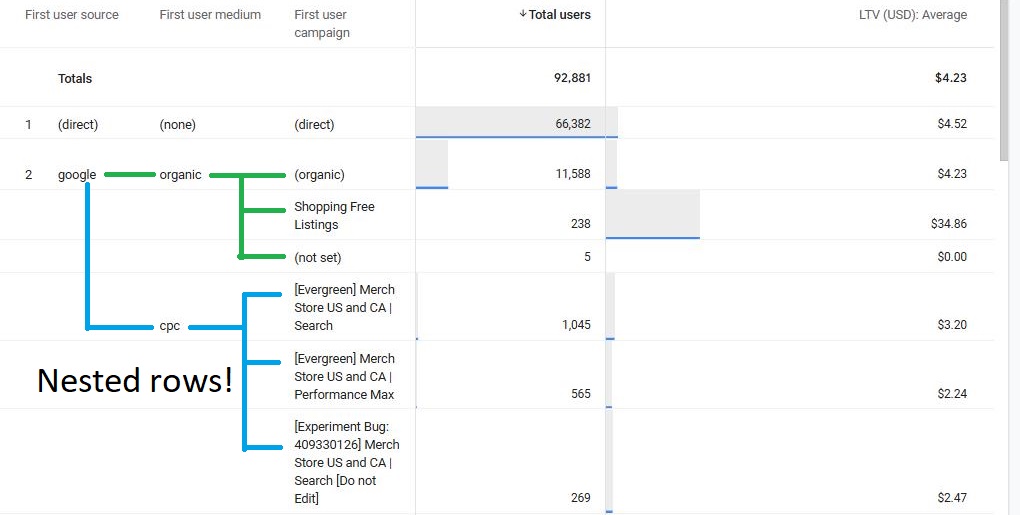
The longer time period you choose the more complete picture you’ll get. However the end date will always be set to yesterday. In this example we see how some channels may underperform in the short term but shine over time.
GA4 Explorations: What next?
Use Explorations to ask very specific questions around your ecommerce performance and get real answers. Because it’s based on raw event and user data, you can investigate whatever matters most to your ecommerce growth.
Pick a question and try it out today. With Explorations, you’re not just reporting—you’re discovering.
Closing tips about sharing, audiences, sampling and more
-
Sharing: To collaborate, click on the share icon in the top-right corner. Others must duplicate the Exploration to edit it. There are also options to export data to CSV, PDF or Google Sheets
-
Audiences: You can turn any segment into an audience. Just click “Create audience from segment.” Learn more about this in our GA4 Audiences video
-
Sampling: Watch for the color of the icon in the upper right corner. If it’s red, your data is being sampled.
-
No data today: Explorations don’t include same-day data.
We have a separate help article covering Calculated ecommerce metrics in GA4. From an explorations perspective it’s good to know that calculated metrics are immediately accessible and also work retroactively — no waiting time required, from the moment of creation in the Admin panel they’re ready for use in explorations.