While Google Analytics 4 users are familiar with the dimensions being table rows and metrics being columns, the actual ‘column’ namespace in GA4 is reserved for something different.
How Can E-commerce Marketers Use Columns in GA4 Explorations for Better Insights?
Unlike standard reports, Explorations in Google Analytics 4 (GA4) allow for flexible use of dimensions and metrics.
In GA4 language, metrics (i.e numbers or numerical values) go to ‘values’ and columns would be a kind of secondary dimensions.
Why Use Columns Instead of Adding a Secondary Dimension?
Adding a secondary dimension in GA4 often results in a long, messy table that’s difficult to analyze. Columns, on the other hand, allow you to break down your main data across a second dimension in a clean, horizontal format.
This structure helps you spot patterns faster, compare performance across categories, and draw better insights without endless scrolling.
Columns in GA4 are often overlooked feature, which can significantly enhance your data visualization, making comparisons more easy.
In this blog post, we'll explore practical use cases of the columns feature in GA4 Explorations for e-commerce merchants. You'll learn how to set up columns in explorations, interpret results, and make data-driven decisions more effectively.
What are GA4 Columns and why are they important?
- Making Comparisons Easier - Adding dimensions to columns allows for easier comparisons, making it much clearer to analyze data than using a secondary dimension in standard reports. This setup avoids overwhelming, long lists and helps highlight key insights at a glance.
- Avoiding Long Row Lists - When multiple dimensions are stacked side by side, reports become cluttered and hard to read. Using columns helps break down data into manageable sections, improving clarity without sacrificing detail.
- Improving Readability - Patterns and trends are more visible when dimensions are distributed across both rows and columns. This layout helps in spotting correlations, performance gaps, and anomalies quickly.
Eager to see GA4 columns in action? Here come the examples!
How to analyze Device in GA4 Explorations with Item category in Columns section
Use this combination of dimensions and metrics to identify best-selling product categories across various device categories:
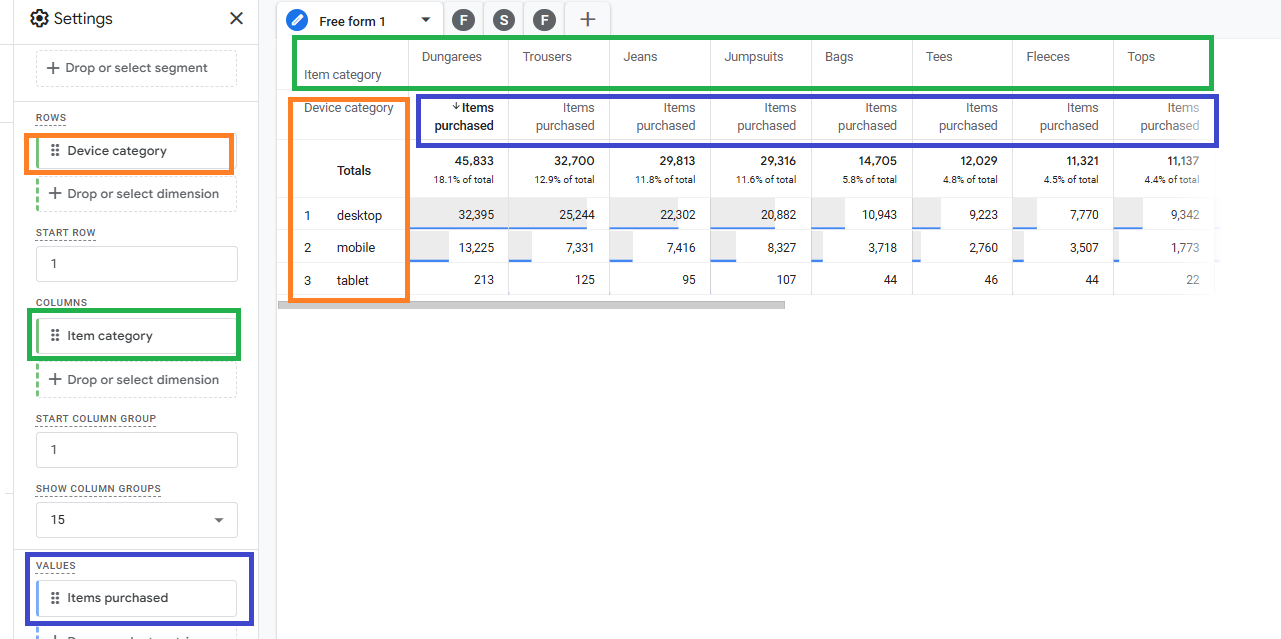
IMPORTANT: Placing the dimension in the 'columns' can ONLY be done by drag&drop method - doubleclicking on a dimension always puts it into 'rows'!
Use the combo above to compare how different product categories’ sales vary depending on device. Spot underperforming categories that may need different placement or promotional campaigns. This comparison showcases how overlapping columns with rows provide rich insights across pairs of dimensions.
How to breakdown Traffic source against Device category in GA4 explorations
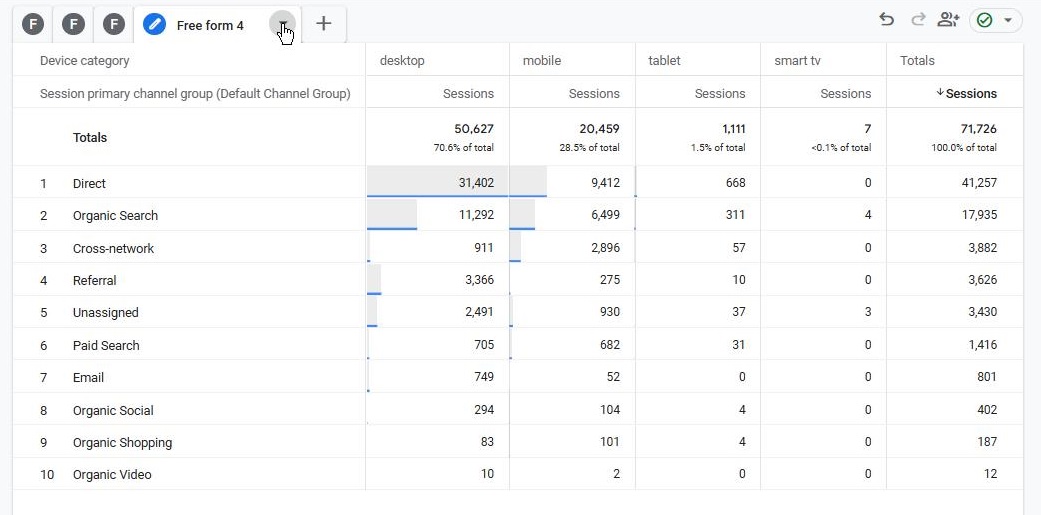
Understand how users shop across devices based on traffic source. Note that this time, devices are in columns - remember it’s all about visibility!
Insights & actionable takeaways from this table boil down to understanding which traffic sources perform best on different devices. Optimize the mobile shopping experience for sources driving the most mobile sales. Adjust advertising strategies based on cross-device performance.
Compare Channel performance based on the Purchase count
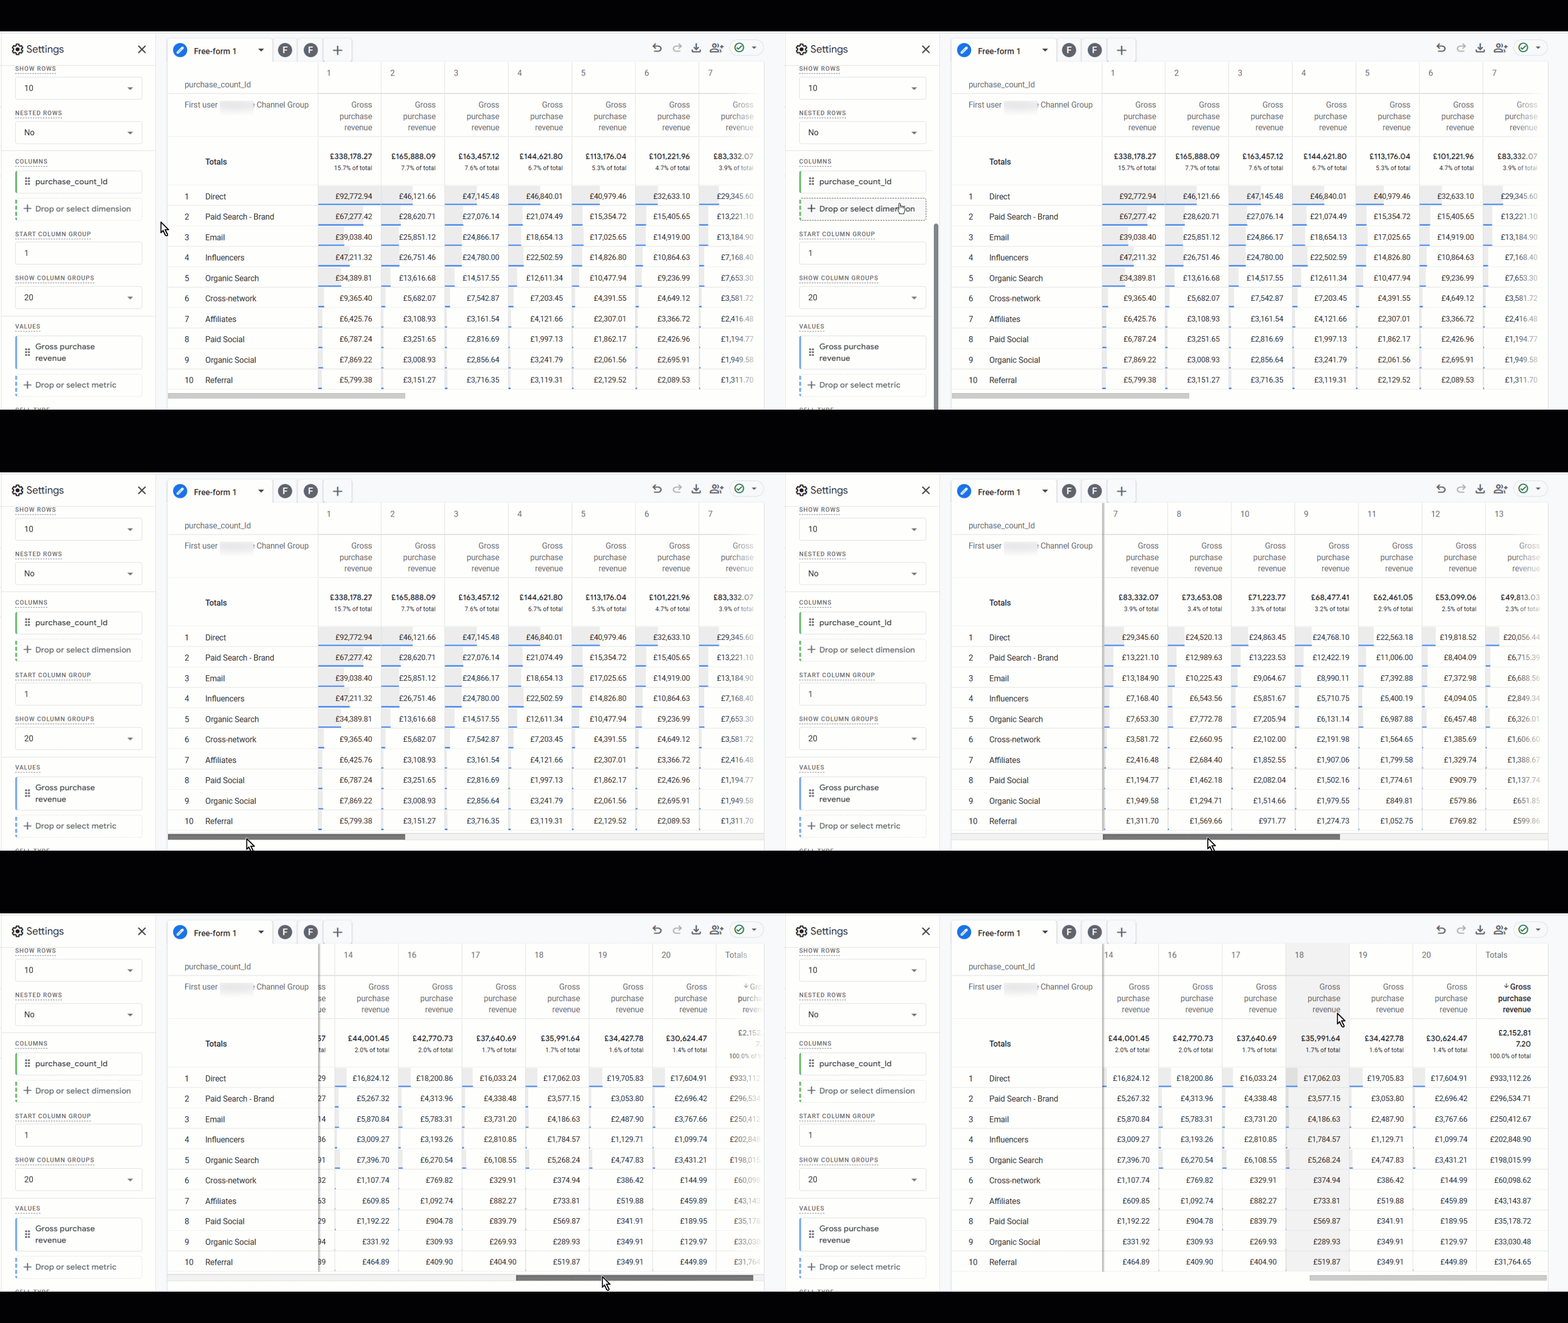
Littledata GA4 connection measures how many purchases each customer had by updating a parameter called purchase_count_ld every time a purchase happens.
This report helps merchants understand how revenue varies depending on different first user channels (i.e traffic source of the customers’ first website visit) when broken down by total number of purchases by a single customer.
Exploration Setup: double-click on First user Channel to put it in 'rows, drag&drop Purchase count Littledata into columns, and finally double-click (or drag&drop) Gross purchase revenue into 'values'
This setup helps you identify potential dropoff in a customer lifetime span to scale targeted marketing efforts effectively.
* Optional - apply GA4 Filters: narrow down data with filters such as geography, or specific user segments, or exclude particular types of purchases.
Does the Google Merchandise Store sell different products across various Age segments?
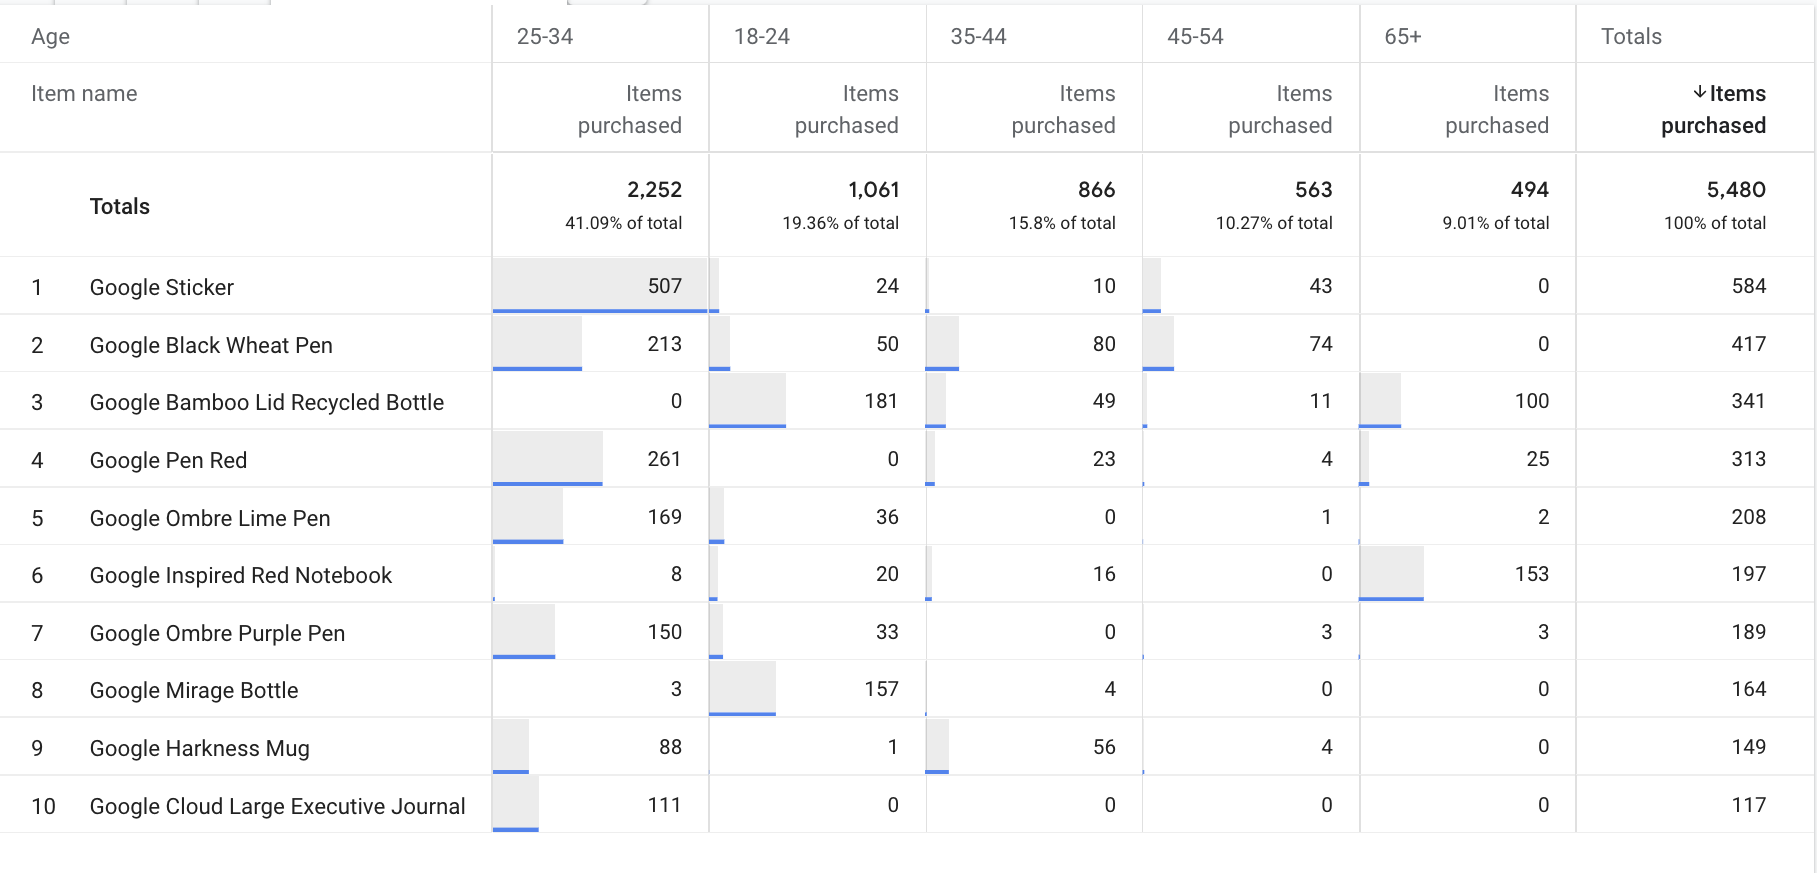
Age could also turn out to be very interesting dimension to break down a metric (or multiple metrics - absolutely doable but kind of go against original reason for using 'colums' which is improved readability!). Note how age plays a significant role in the Category of Google product sold!
Revenue by channel split between New and Established users
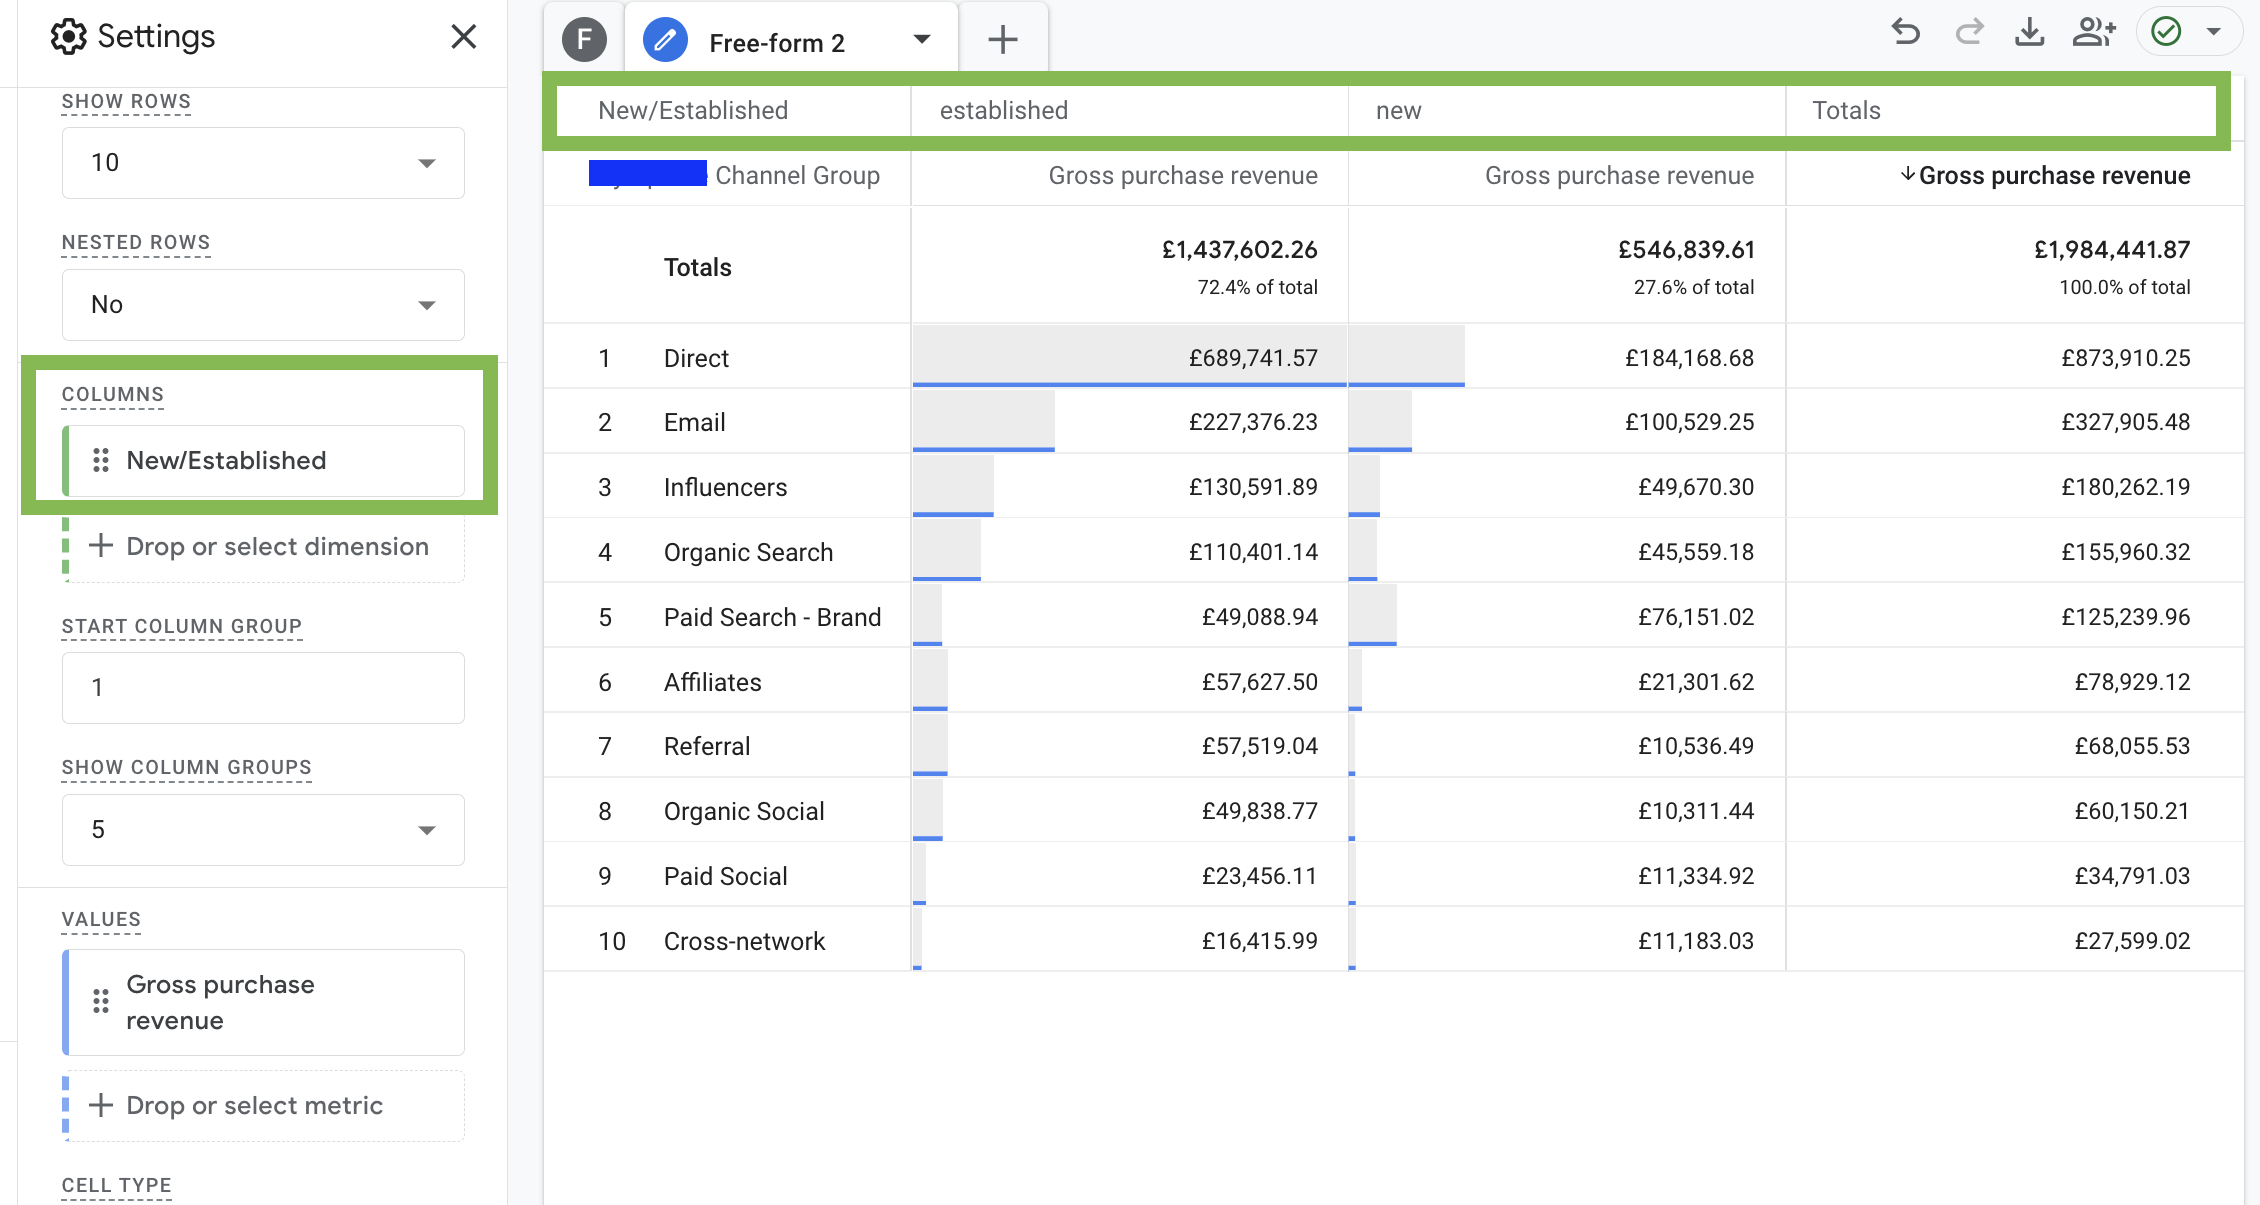
NB: according to official Google docs - user is considered “established” 7 days after their first_visit event
Bonus tip:
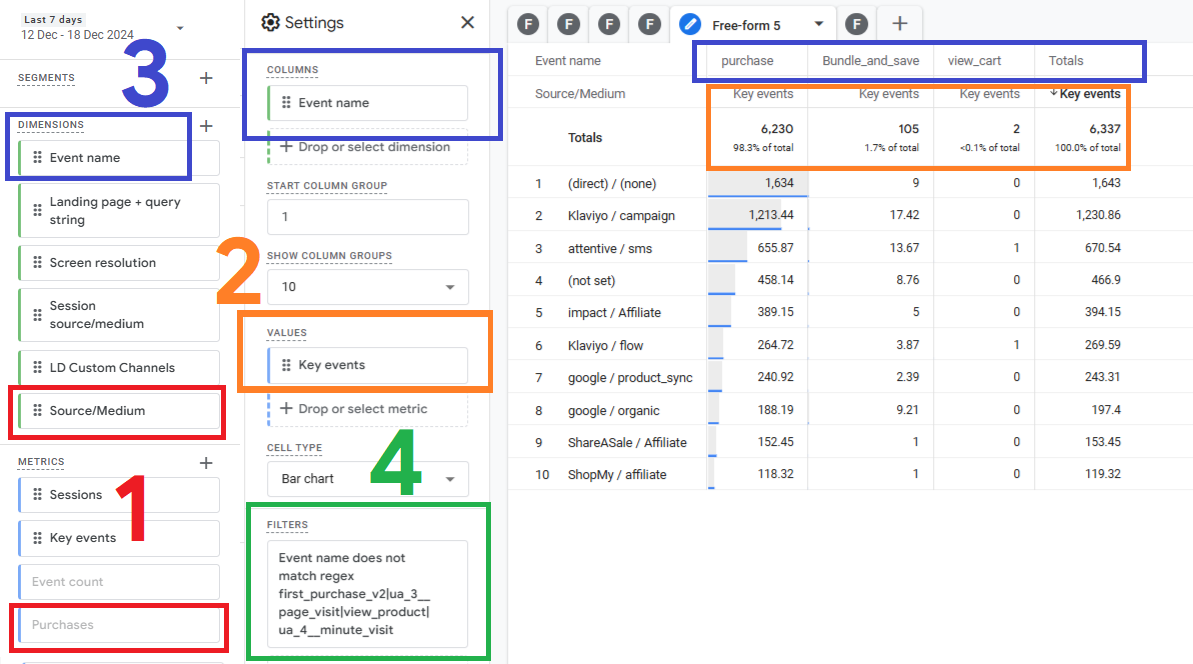
Here’s how you can analyze modelled (1) key events as columns - regularly not applicable (pls note that purchases are grayed out in the metrics section!):
Place 'key events' in columns (2), add event name as a dimension(3) and apply a filter (4) to exclude all the unnecessary key events (in case you have more than the default - purchase):
Final Thoughts
Using columns in GA4 Explorations improves data visualization, enhances readability, and helps uncover hidden insights that might be missed in standard table reports.
By applying dimensions like Item Category, Age, Purchase Count in columns (or any other you find useful!) you can make smarter business decisions based on comprehensive, well-structured data. Don’t hesitate to experiment with different combinations to find the layout that works best for your analysis.
Happy analyzing! 🚀