GA4 Calculated Metrics for understanding ecommerce performance
Calculated metrics in Google Analytics 4 are a very useful tool to fill reporting gaps. We thought you’d like to see which calculated metrics the biggest brands use in GA4 when analyzing their data.
How to add a calculated metric
First, go to the Admin panel > Custom Definitions section:
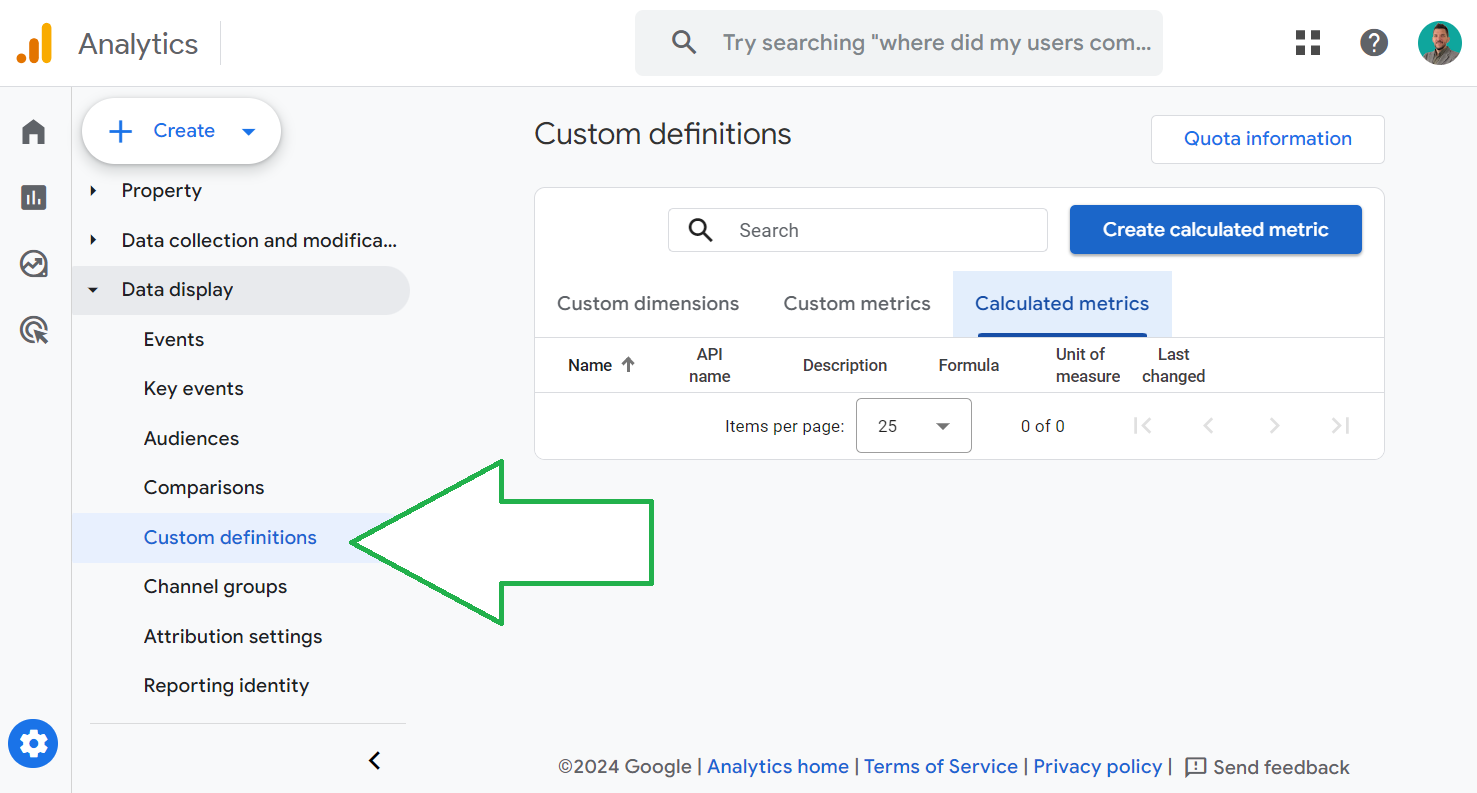
Once you’re inside the Custom Definitions panel, select the Calculated Metrics tab.
Right there you will see if this feature has been rolled out into your particular account. Google announced that “We have begun moving this feature out of alpha and into general availability. You can expect to see this feature in all of your GA4 properties over the next couple of weeks.” Now considering their promises to remove cookies in 2022 from Chrome browser - “next couple of weeks” can stretch 😀
Now click on the blue “Create” button

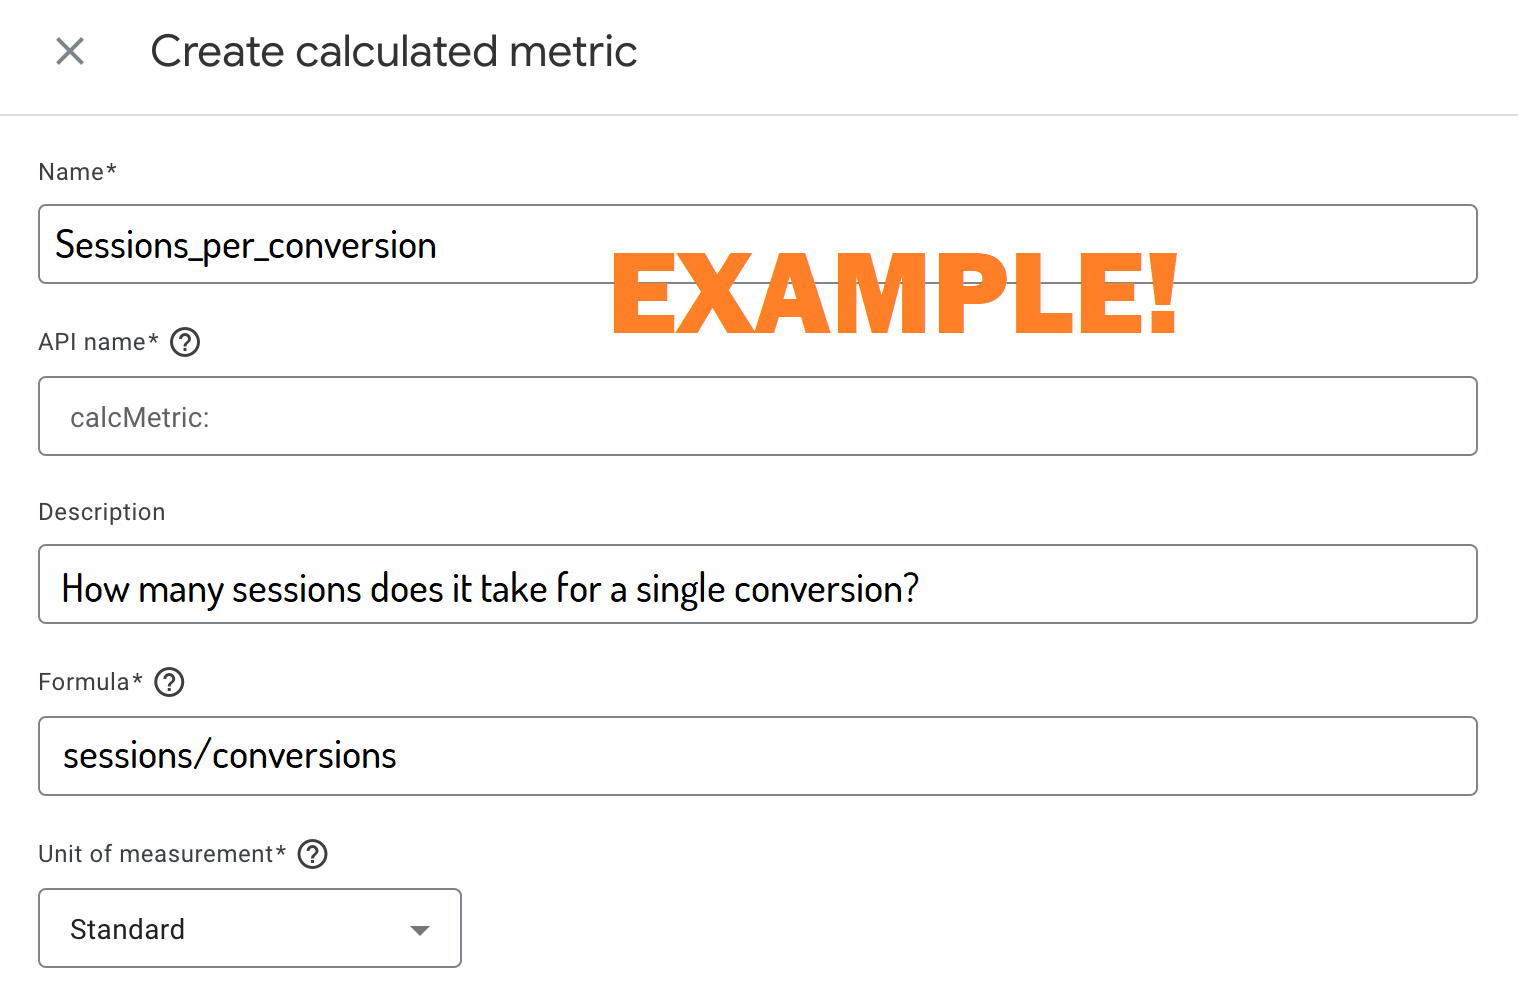
Here is just an example of what inputs you need to create a calculated metric. We’ll consider this particular example later. Pro-tip: use the optional field “Description” to say to your-future-self and your colleagues what you had in mind when creating the metric.
The calculated metrics you need
So here are our top three calculated metrics for any ecommerce website:
Add-to-carts per Item-viewed
This ratio helps you understand which products are attracting real buyers, and on the flipside which ones are magnet for tire-kickers.
It can also paint a better picture about channels and the quality of the traffic they bring in. It can be very interesting to split this metric by the campaign name. Imagine you have several social media campaigns, or Google ads campaigns for that matter - wouldn’t you like to know how the campaigns rank in buying intent vs “I’m just looking I’m not buying” behaviour?
Purchases per Add-to-cart
This calculated metric is the younger sibling of the previous one - it answers the question: Which products are actually BOUGHT after being added to cart?
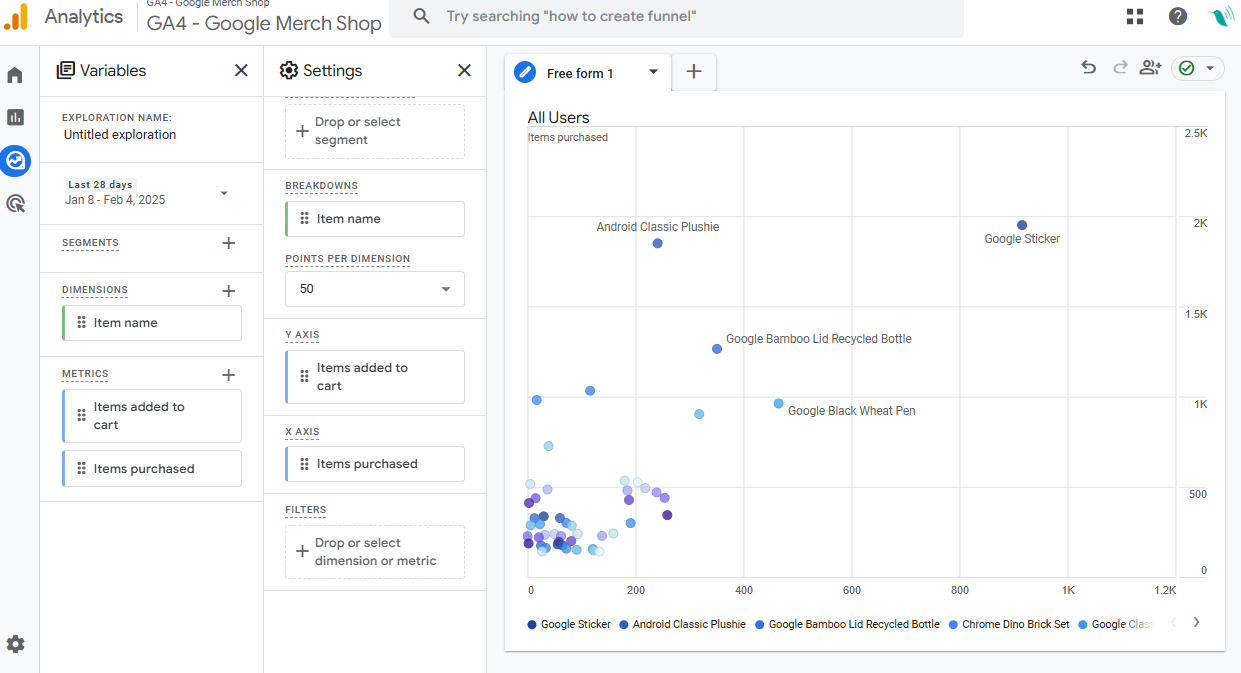
Are there particular products that are abandoned in the cart more often than others and if yes, why would it be the case?
To learn how to create a report like the one above, visit our blogpost about the Shopify Product Conversion Rate in GA4.
Again, various dimensions that can be applied here (channel, source/medium, campaign, product, anything that takes time into consideration..) will lead to eye-opening insights.
Units-per-transaction
The number of items that get purchased together can be looped back into the ad platforms in order to pull the most bang for the advertising buck.
It still can’t be overstressed how applying different dimensions for any of the metrics described here can produce insights not accessible elsewhere. For example
Percent of NEW users
Divide new users by total users and the ratio will tell you how much each channel contributes to bringing new people to your website.
Sessions per conversion
This one is nothing but an inverted version of Conversion rate (it’s actually the one from the screenshot above).
So imagine you have two Google ads campaigns that converted at 2.27% and 2.63% respectively. Wouldn’t it be more convenient to say that the 1st one converts once in every 44 sessions whereas the second one does the same every 38 sessions?
Put in the CPC for each of the two campaigns and you’ll understand how convoluted the results are with percentages and how much easier it would be with a simple integer - how many sessions does this campaign/channel/source medium combo take to convert once?
The same logic can be applied to Users per conversion - how many users does it take for a single conversion to happen?
BONUS Rolling 4-week retention
This one came up as a result of surveying our customers - it makes it easy to understand how many customers actually come back after their first visit during a 4 week span.
Turns out that there’s no need for calculated metrics on this one as it’s already available in the Explorations section - simply use a GA4 cohort exploration and set the parameters as we did in the left hand side menu:
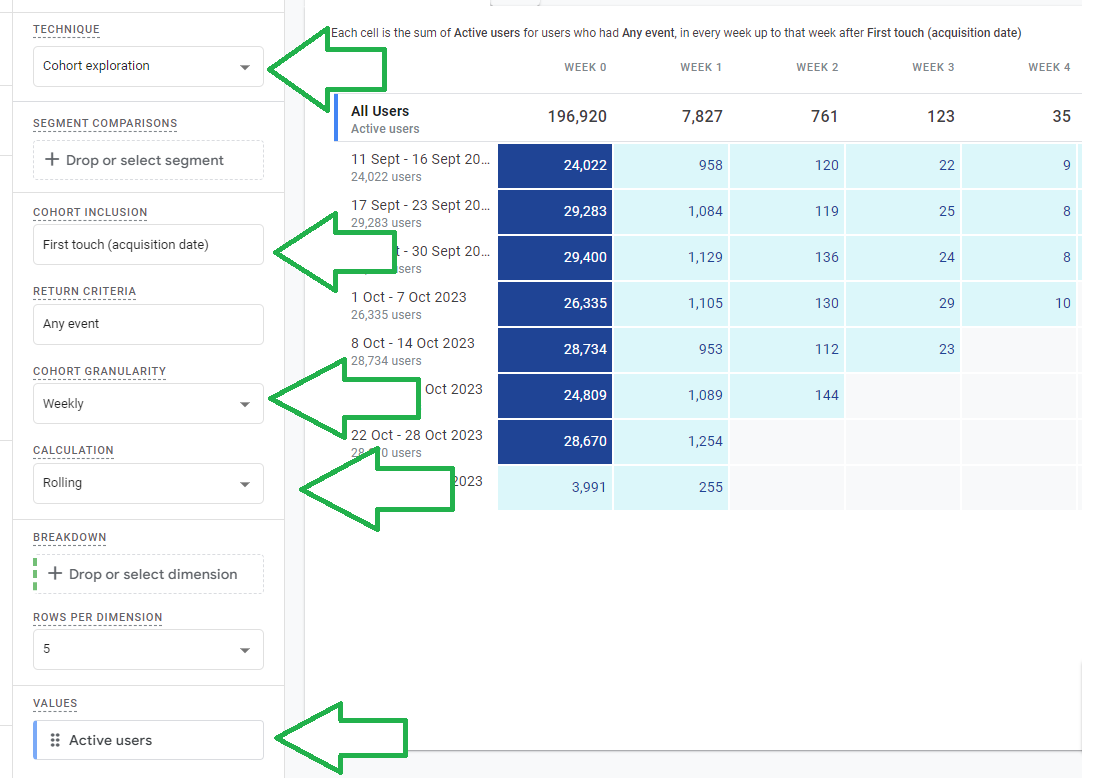
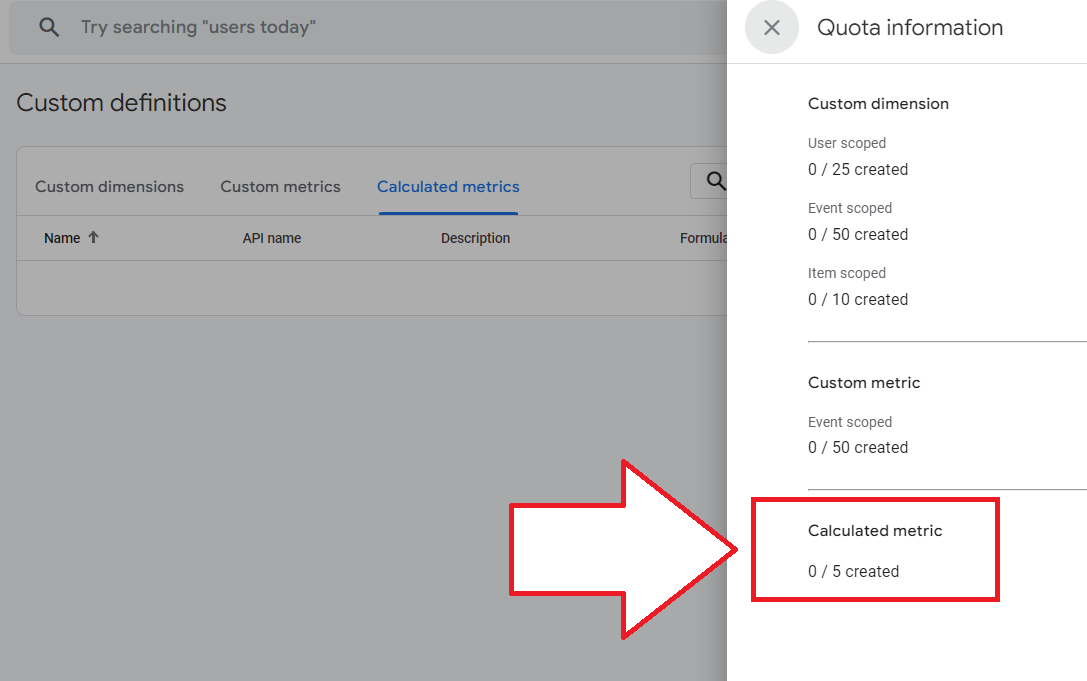
Why did we call this last one a BONUS? Because currently GA4 limits you to only 5 calculated metrics! But no worries, if you create one and it doesn't reveal the useful truth, you can archive it (permanently!) and the slot becomes open:
Conclusion
While there are numerous ways to combine the existing metrics into new ones that give you a quick insight into otherwise head-banging issue, some are definitely more useful and widespread than others. In this article we gave you an overview of the few we see a lot across properties but we also wanted to inspire you to come up with your own.