Unlocking the power of Scatter Plots in Google Analytics
Google Analytics 4 (GA4) offers a variety of tools to analyze your data, but some features, like the scatter plot (or how Google calls them "scatter chart") often go unnoticed. This powerful visualization tool has the potential to provide actionable insights, yet it remains underused, partly because its purpose isn’t always clear in everyday analytics work.
In this blog post, we’ll uncover why the scatter plot deserves a place in your analytics toolkit and how it can transform your understanding of key metrics.
What makes scatter plots special in GA4?
Simply put, scatter plots allow you to compare one dimension against two metrics simultaneously. For instance, you can evaluate your campaigns based on both traffic volume and purchases, identifying which efforts drive value versus which fall short.
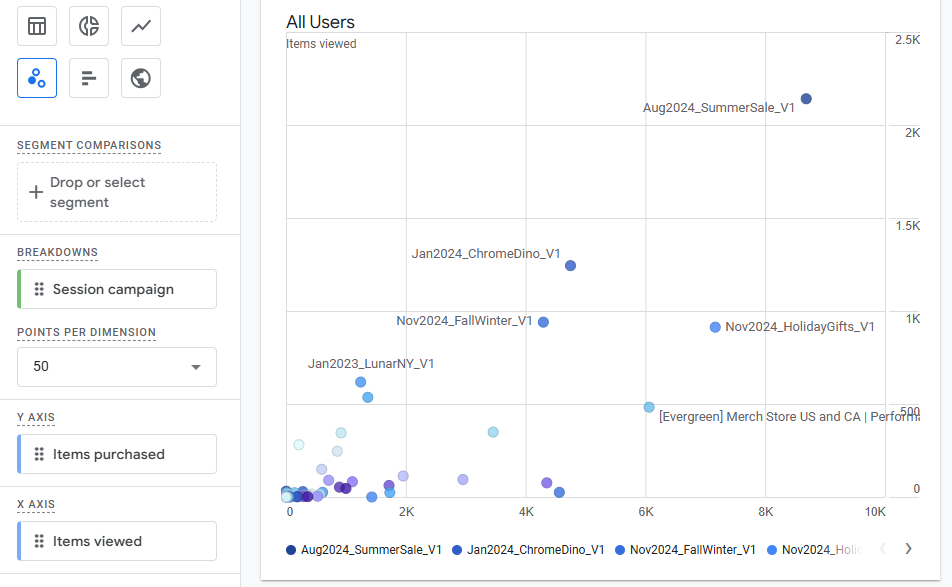
Take a look at the campaign performance comparison on the scatter plot above: the X-axis represents how many times a campaign led to view_item event, while the Y-axis tracks revenue. Suddenly, your data tells a story:
- Campaigns with low traffic but high revenue signal efficiency like Jan2024_ChromeDino_V1
- Campaigns with high traffic but low revenue might highlight inefficiencies or underperforming strategies e.g [Evergreen] Merch Store US and CA
- Campaigns worth investing more into like Jan2023_LunarNY
In this particular case, the campaign from the insight #3 is tied to a specific point in time but it sure produced high buy-to-detail [%] so it would have made a good candidate to pour more budget into.
This type of visualization simplifies the process of pinpointing which campaigns deserve more budget and which need reevaluation.
Real-world scatterplot applications: campaign analysis
1. Comparing campaign performance
Using scatterplots, we can clearly differentiate campaigns by their performance. In the following example we'll evaluate revenue per session of multiple campaigns:
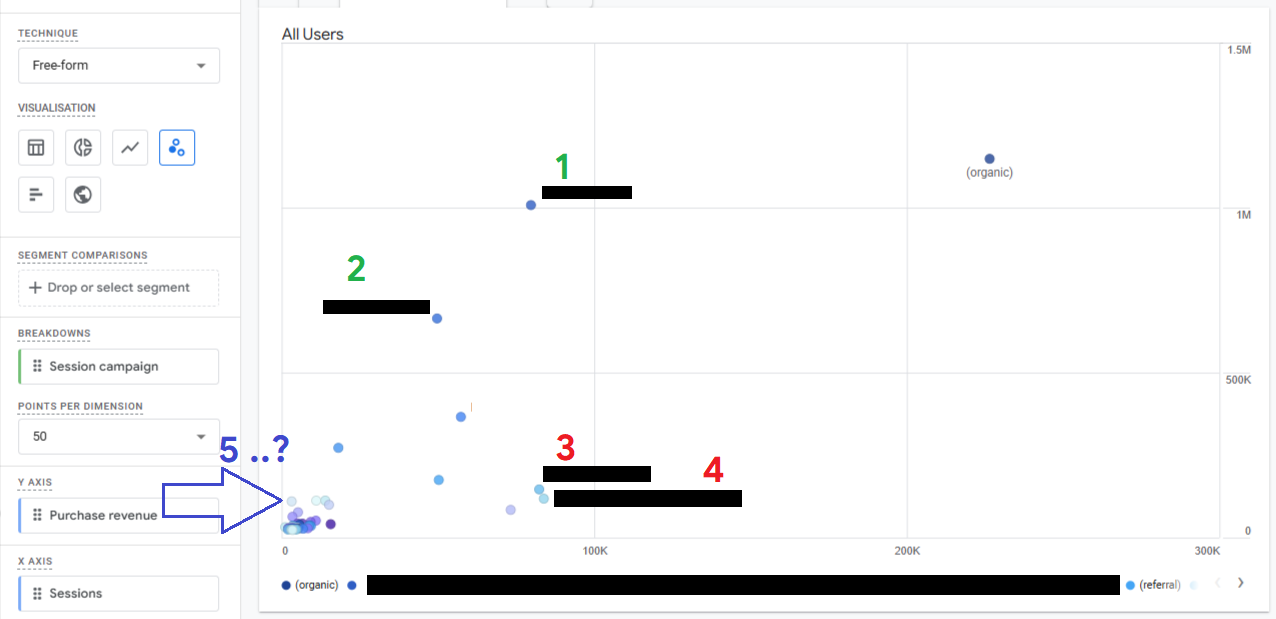
- Campaign 1 generates significant revenue, far outperforming Campaigns 3 and 4, despite similar traffic levels.
- Campaign 2 delivers lower revenue compared to #1 but is proportional to its smaller traffic volume, indicating a reasonable return on investment.
- Campaign 5, while showing a high return on ad spend (ROAS), struggles with low traffic. This suggests scaling efforts are necessary to test its full potential.
2. Evaluating ROAS and traffic sources
Scatterplots also help analyze campaigns’ efficiency when comparing traffic "temperature" - particularly for products with longer buying cycle - when conversions don’t happen immediately. The following graph shows traffic coming from various sources such as YT shorts i.e very cold audience, but also more bottom-of-funnel traffic that should produce higher ROAS.
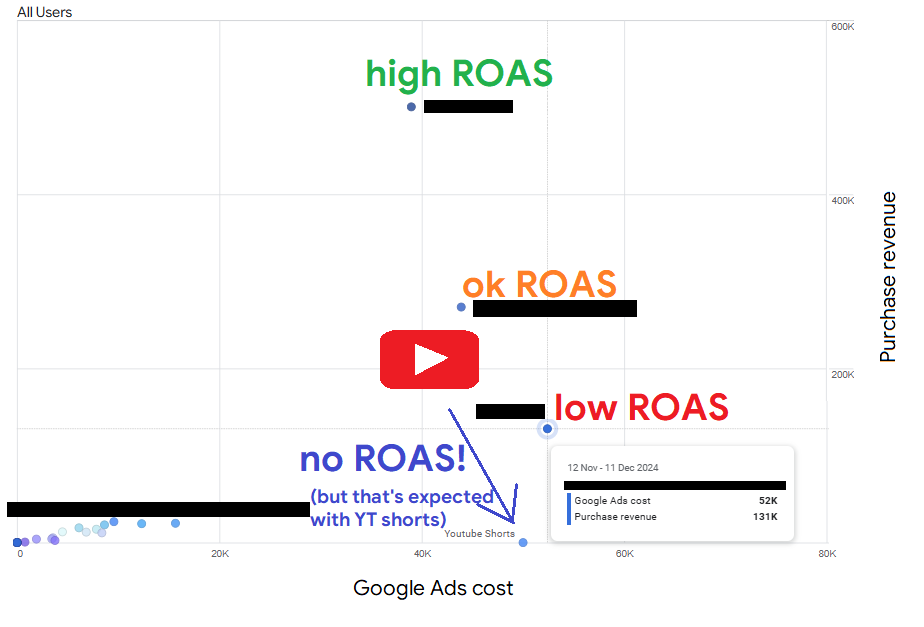
In this instance, the campaign with high costs but low ROAS might signal ineffective targeting or the need for audience refinement.
Exploring behavioral patterns with scatterplots
1. Traffic vs. purchases by time of day
Scatterplots reveal how visitor behavior varies across the day:
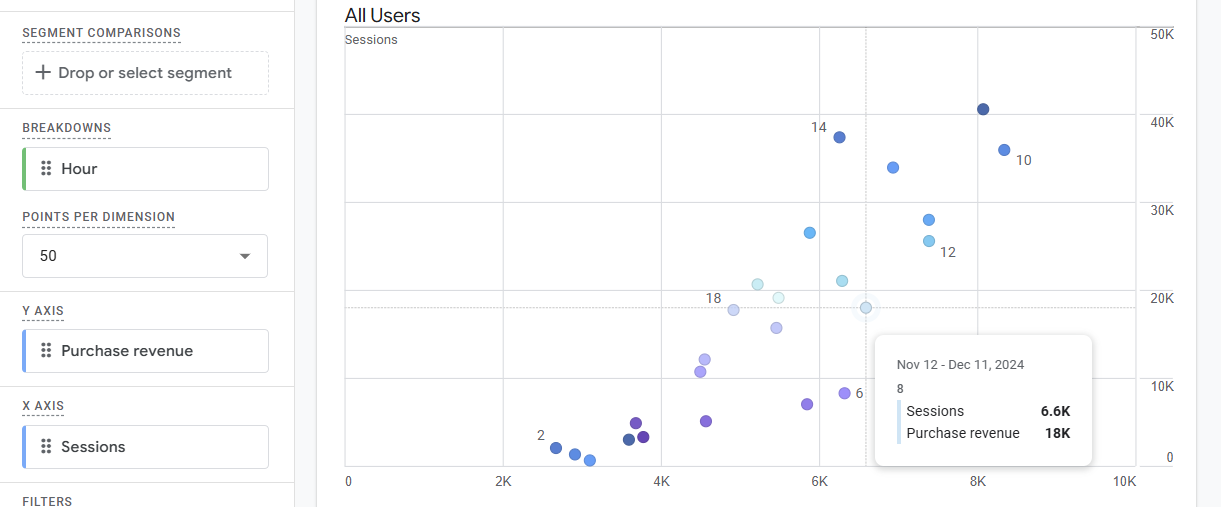
Some time slots may drive more traffic but result in fewer purchases. Insights like these can inform ad scheduling and budget allocation to maximize conversion opportunities.
2. Revenue vs sessions by day of month
Analyzing daily performance metrics helps uncover trends, such as mid-month spikes or end-of-month slumps:
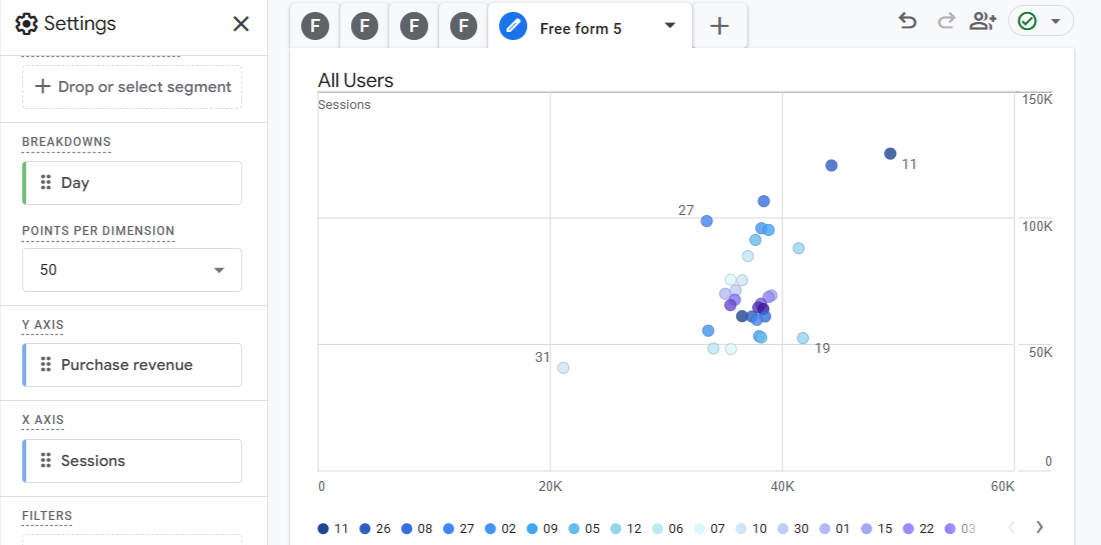
In this example, a scatterplot shows that the 11th of the month performs significantly better for both sessions and revenue compared to other days.
Advanced use cases: filters and soft dimensions
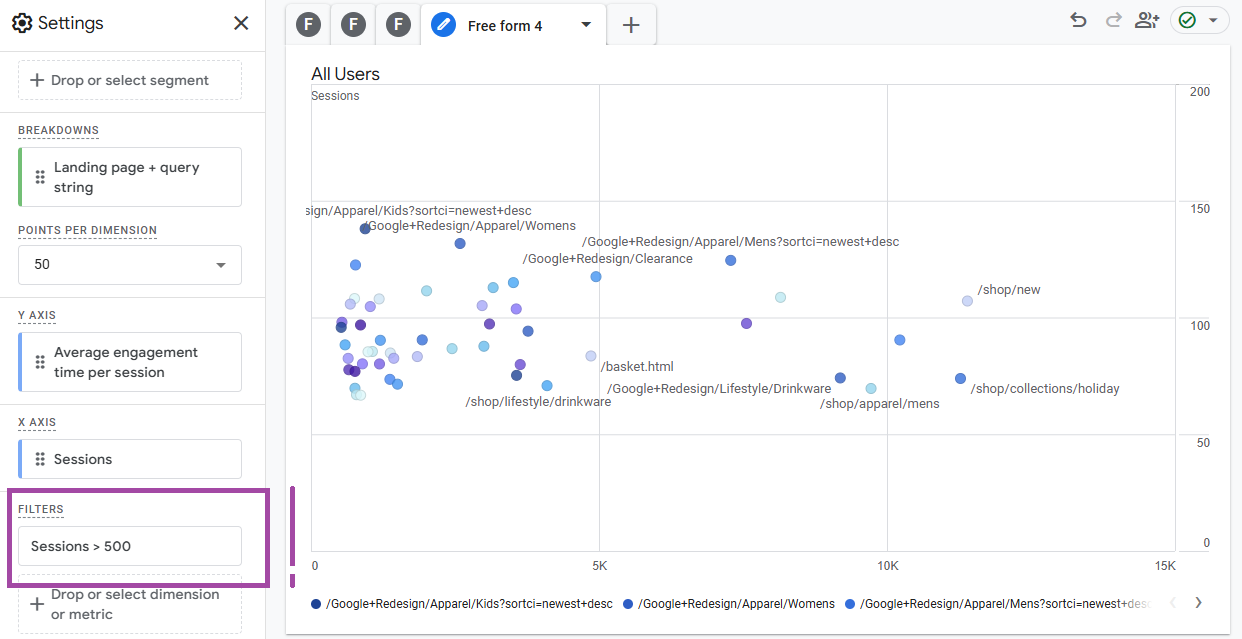
One of the scatterplot’s most versatile features is its ability to apply filters beyond the visible metrics.
In this example the country filter is used to evaluate performance in specific regions:
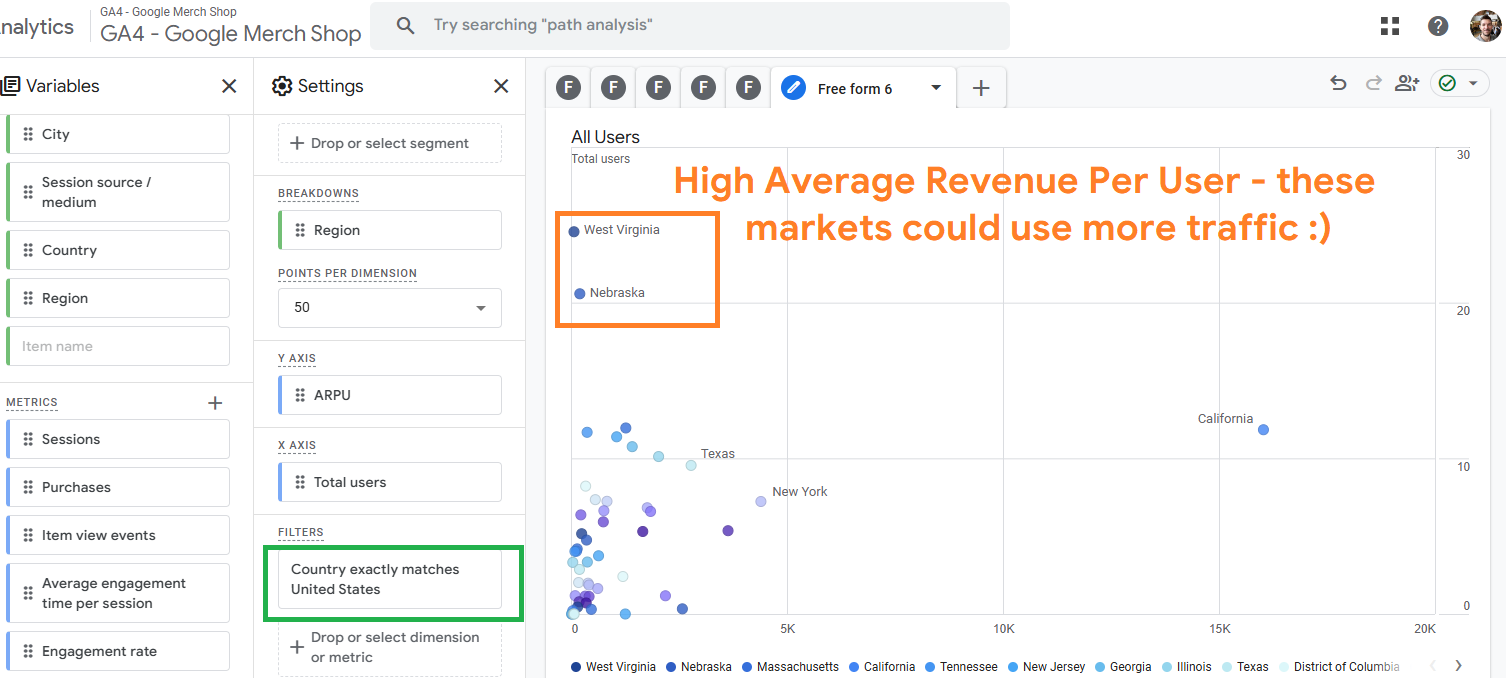
You can also break down engagement metrics, like average session duration, by landing page for brands with longer sales cycles:
Product performance: Items seen vs. Items purchased
We showed in a previous section how scatterplots can also analyze individual product performance. By comparing items seen versus purchased, you gain insight into customer preferences and identify products with high interest but low conversion rates. For a deeper dive into this analysis, check out our dedicated blog post on ecommerce product conversion rate in GA4.
Final thoughts: leveraging scatter plots for E-commerce success
While scatterplots won’t always produce groundbreaking insights, they provide a dynamic playground for investigating data patterns. By comparing dimensions against two metrics, you can uncover hidden opportunities and optimize your strategies for better results.
Whether you’re analyzing campaigns, visitor behavior, or product performance, the scatterplot is a valuable tool for uncovering actionable insights. Start experimenting with scatterplots in GA4 today to elevate your analytics game and drive your e-commerce success!