Building a Lifetime Value report In GA4
What is a Lifetime Value report?
The User Lifetime Value report lets you understand how valuable different users are to your business based on their lifetime spend. Every time a user buys something - their Lifetime value (LTV) increases by the amount of the purchase.
Littledata's GA4 integration helps Shopify store owners by attaching each purchase amount to the user and sending that piece of data to GA4 whenever a purchase happens.
This also happens with recurring orders: every time a user is charged for their subscription their LTV increases.
What is the best way to use LTV provided by Littledata?
Littledata sends the customer LTV to GA4 as a user-scoped custom dimension.
This allows us to create user segments based on their lifetime spend. Once we set up LTV segments we can compare particular campaigns i.e. the total revenue created by users who first came via specific marketing effort.
In this screenshot we see users brought by each YouTube influencer and what they end up spending (subscription revenue included):
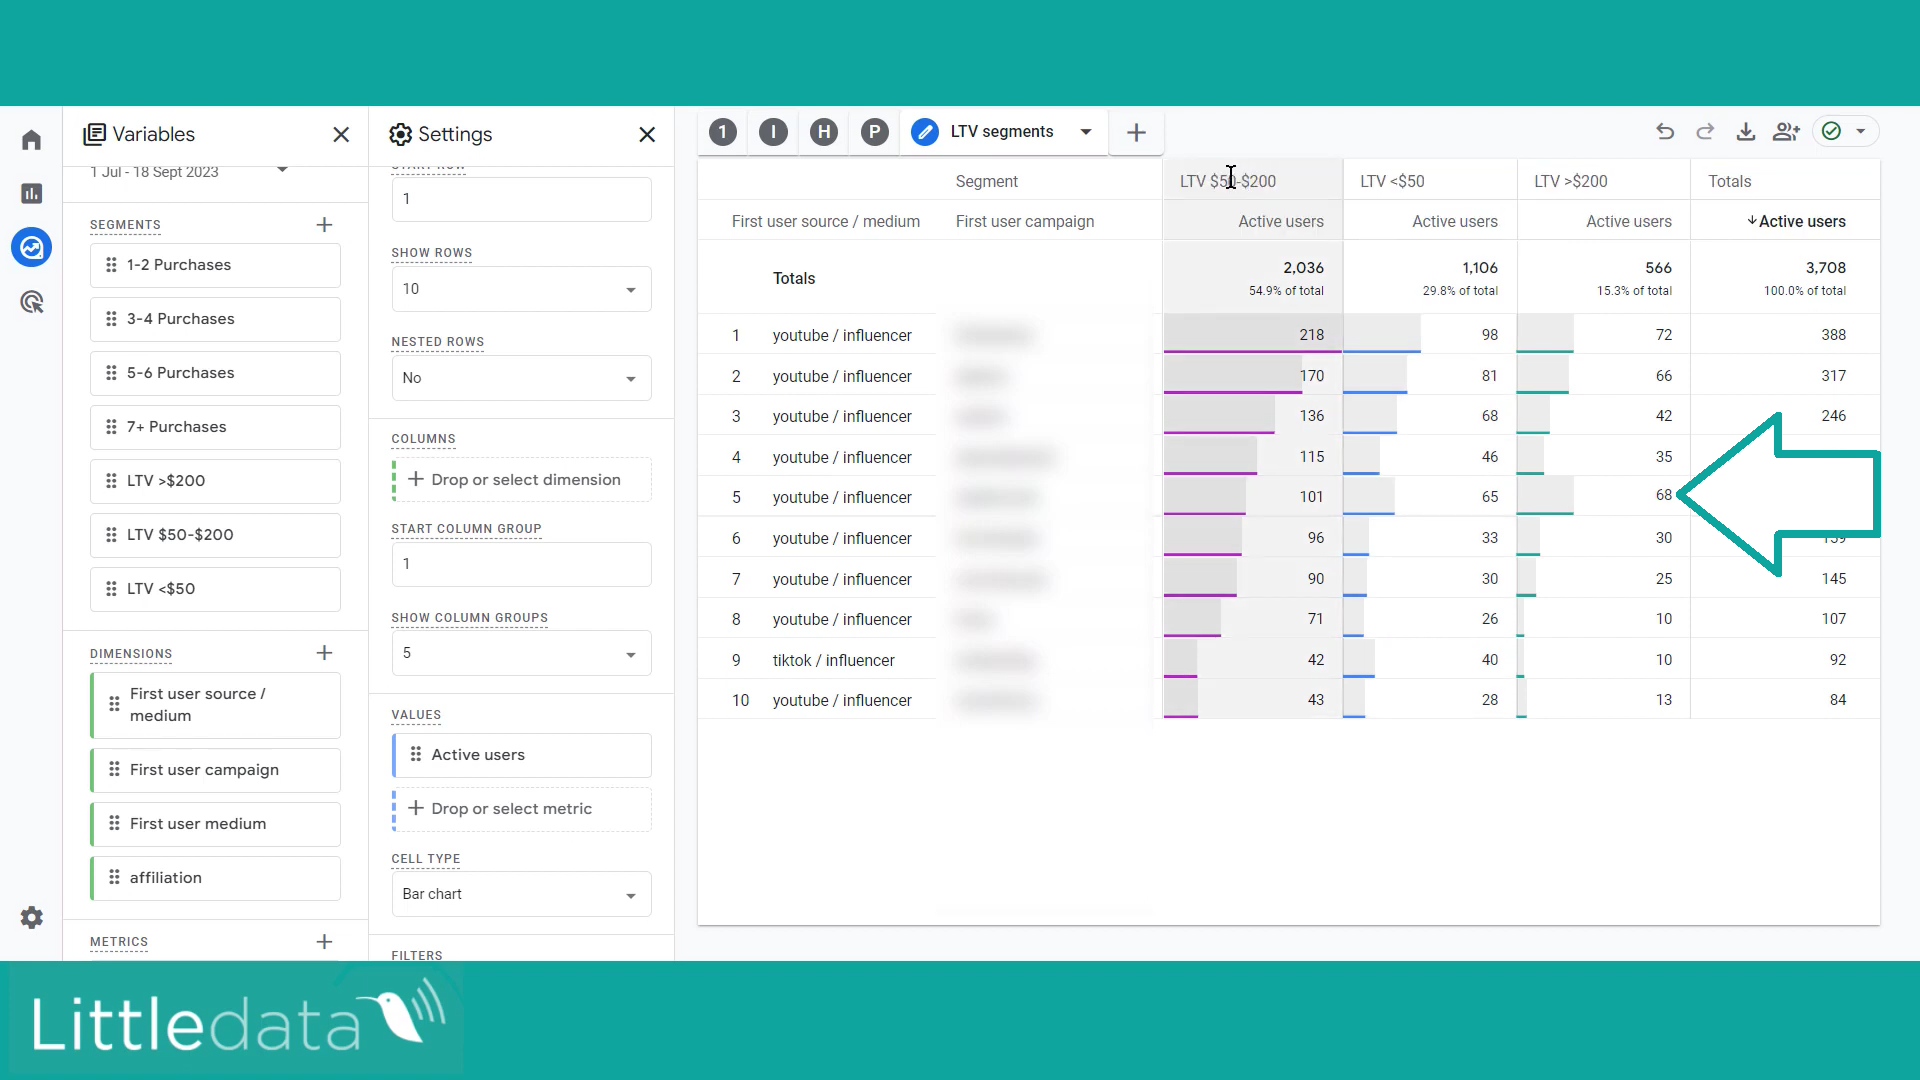
Campaign names have been blurred for privacy reasons, but you can easily notice that the influencer in row #5 is good at bringing high-value customers - should this merchant should double-down on promoting with them? Absolutely!
Built-in User Lifetime Value report in GA4
The native Lifetime Value Exploration in Google Analytics will show you the total value you have earned from a group of users over a certain period of time. This value can be monetary but you can also analyze how engaged each group is over particular period of time.
You might notice that terms 'report' and 'exploration' are used interchangeably here - according to Google's naming convention, LTV isn't a report but an exploration - once you open the Explorations section, scroll horizontally all the way to the right:
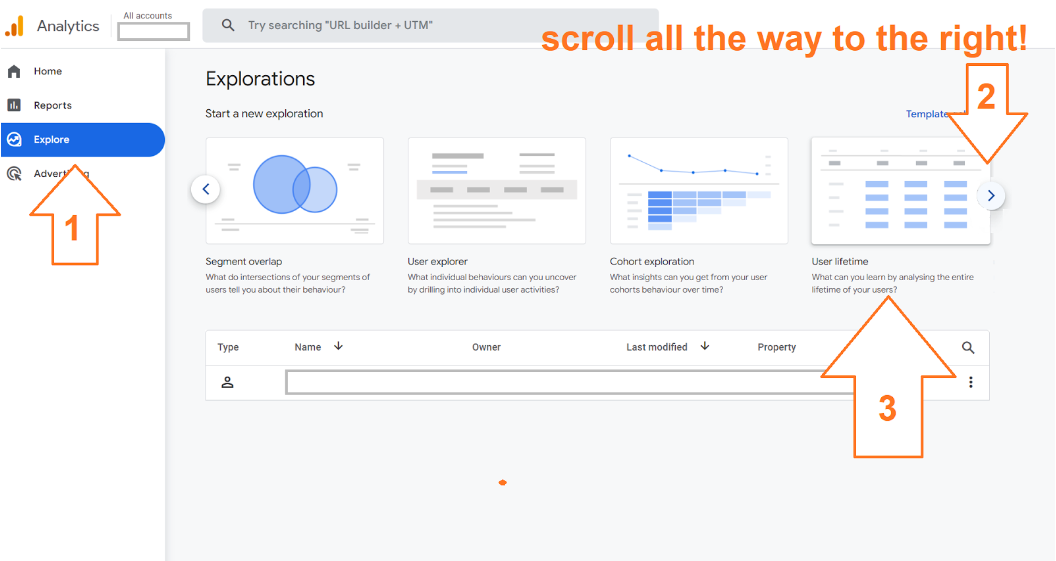
Before we dive deeper into practical advice on how to create and make use of User Lifetime Value reports - let’s talk about Google user LTV vs Customer LTV.
How does User Lifetime Value report differ from the Customer LTV dimension?
GA4 offers a User Lifetime report in the exploration section. While the concept is similar to the common business metric called Customer Lifetime Value there are substantial differences that should not be overlooked.
Customer Lifetime Value (LTV) is a custom dimension sent by Littledata that helps us understand how much a business earns from an average customer over the course of the whole customer/business relationship. This might include before the store moved to Shopify, if the orders on a previous ecommerce platform were imported.

Customer loyalty and its evil-twin metric Churn, are two of the most important things to keep an eye on if you want to increase LTV.
As you can imagine - the lifetime of a customer plays a significant role here as it influences this metric heavily - the longer a customer continues to purchase from a company, the greater their lifetime value becomes.
There are two major differences between customer LTV and user LTV in GA4
- User lifetime value covers ALL the users of your website or app (not purchasing customers only!). This metric is significantly lower than Customer LTV because its calculation doesn’t include customers only but also those who don’t spend a penny on your offering. This means that user LTV gives you a wider perspective as the volume of non-spenders strongly affects the bottom-line performance of any group of users.
- While customer LTV dimension is across the whole customer lifespan (on Shopify), the user LTV in GA4 is directly tied to the selected date range - it shows how a particular group of users performed during certain periods.
How do you create User Lifetime exploration?
Once you click on “User Lifetime” exploration template as described in “Where can you find User lifetime report” above, GA4 will automatically create your first User Lifetime exploration. It will be pre-populated with one-size-fits-all dimension and metrics:
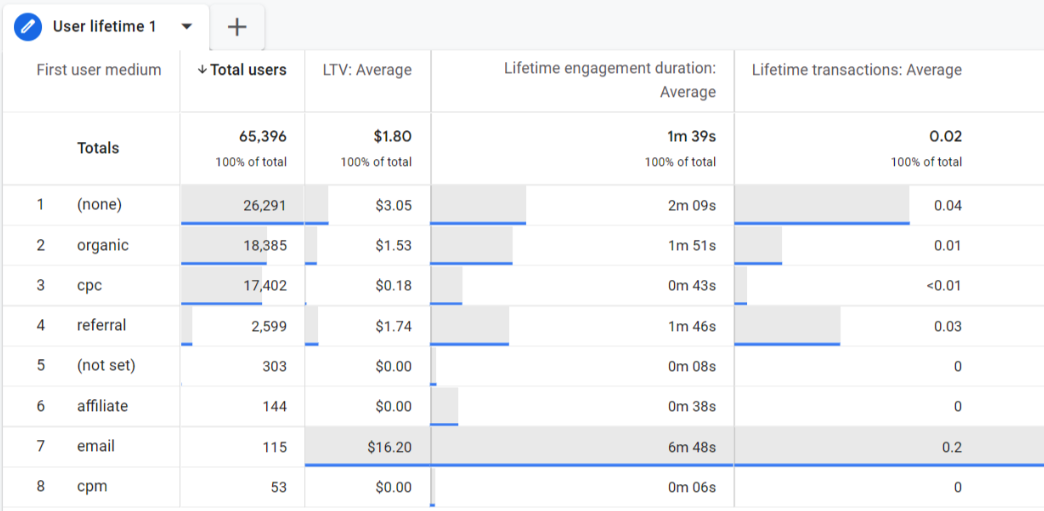
- Rows (i.e. dimension) represent First user medium - how a particular group of users first came to your site
- Metrics are:
- Total users
- LTV Average
- Average lifetime engagement duration
- Average Lifetime transactions
Let’s focus just on the table here - we’re looking how each cluster of users spend when you group them by the medium i.e. type of traffic that brought them to your website for the 1st time!
Looks cool? There’s more!
NB: each First medium group has average transactions < 1 which proves the point about non-buying users being included in the report!
Now let’s give the right hand side menu proper attention
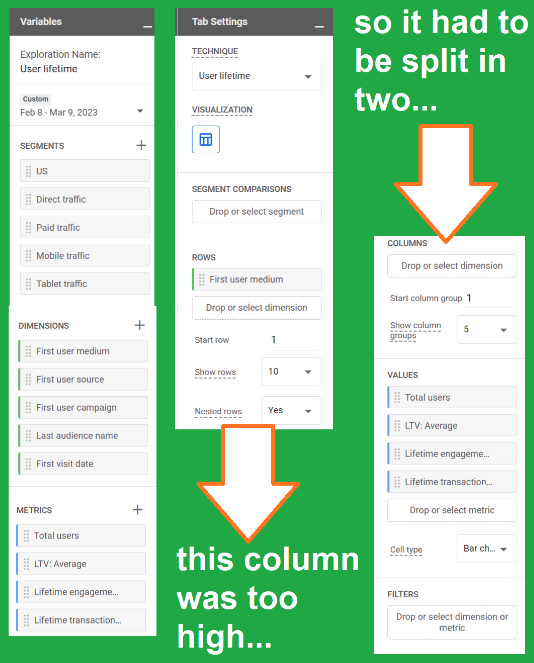
Apart from the date range selector, the left column represents the available choices for segments, dimensions and metrics.
The right column shows what is actually incorporated in the current report. It also offers filtering option, if you scroll all the way to the bottom of it.
User Lifetime report: use-cases
User Lifetime report in GA4 helps you determine the commercial performance of a particular group of users.
Let’s start with the simplest - the default setup will tell you how each medium performs when it comes to billing:
(the data in this screenshot is from the Google merchandise store)
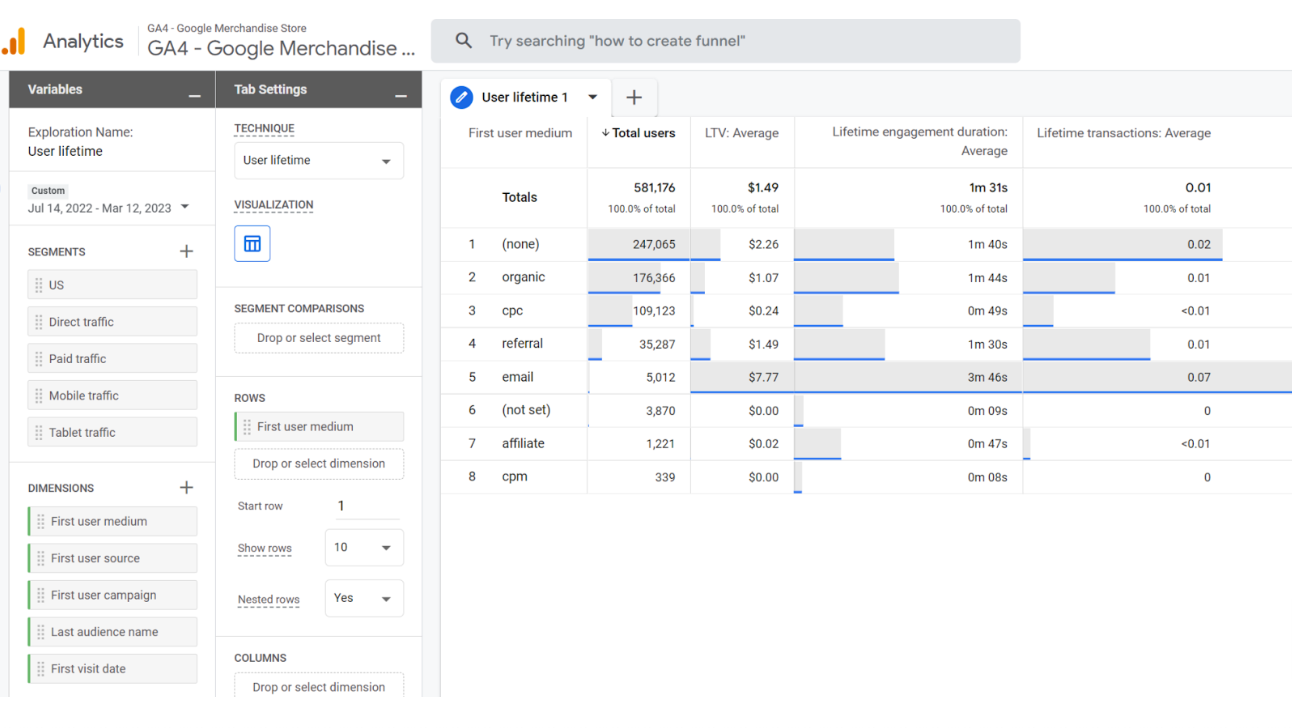
By looking at this report we can tell that their affiliate scheme(s) and cpm campaigns are not working.
We can also say that referrals are outperforming the organic search, and that visitor from email are, by far, most valuable ones.
Now let's give a bit more context to the data by adding First user source as second column. Simply double click on it in the left-hand setup column, under dimensions, and it will appear in the report:
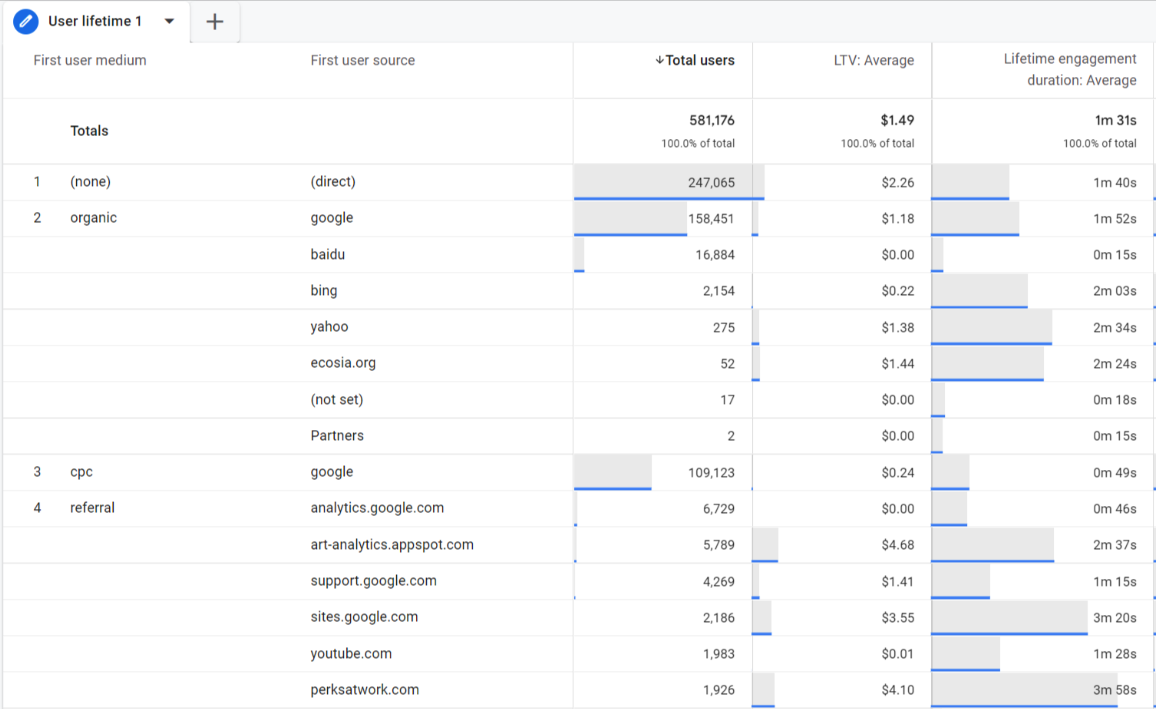
This report tells us that geeks coming from analytics.google.com never spend on the Google merch while those from art-analytics website pretty much make it up. YouTube visitors are also not buying but perksatwork.com people improve the bottomline.
It also provides insights about non-monetary metrics like Average engagement time, Average number of engaged sessions etc.
The most important thing is to understand that these numbers reflect how groups of users perform over time!
Examples:
- People who first came to your site the day before Christmas
- People who first came via a particular source/medium combination
- People who belong to a GA4 audience
These are just a few examples and each business should define cohorts in the way that fits their experiential data.
How does GA4 calculate user Lifetime Value?
Calculation of User Lifetime Value relies on 2 factors:
Rt - total revenue generated from a group of users
Ut - total number of users that belong to a group
LTV = Rt / Ut
NB: “Lifetime” as a part of the GA4 report name is a bit misleading here. For a particular group of users - the value CHANGES, as you change the date range.
Recap: User Lifetime Value reports in Google Analytics 4
User Lifetime Value exploration can be extremely useful and valuable for your business if you want to understand how particular channels, campaigns or audiences perform long-term.
Clever use of these reports will help you constantly increase you ROAS. But have in mind that analyzing the periods that include high-converting time of year (like Black Friday for example) may strongly affect your numbers. While the overall revenue may spike during these periods, it’s the actual volume and, subsequently, the conversion rate that will make or break your bottomline.
As we already stated the non-spenders influence the end result, longer timespans mean more users, and if they turn out to be tire kickers - the average value will drop. On the other hand if you actually succeed in converting high-volume traffic into high-spenders - the LTV will skyrocket, and your marketing mix would perform as never before!