How to build a Sales Performance report in GA4
Littledata provides an automatic Google Analytics connection for Shopify.
GA4 properties have a more flexible approach to reporting, but the downside is you need to build your own reports with a variety of dimensions and metrics.
In this article, we'll show you how to build a cohesive Sales Performance report step by step, which was a commonly used standard report in Universal Analytics.
Create a free-form exploration
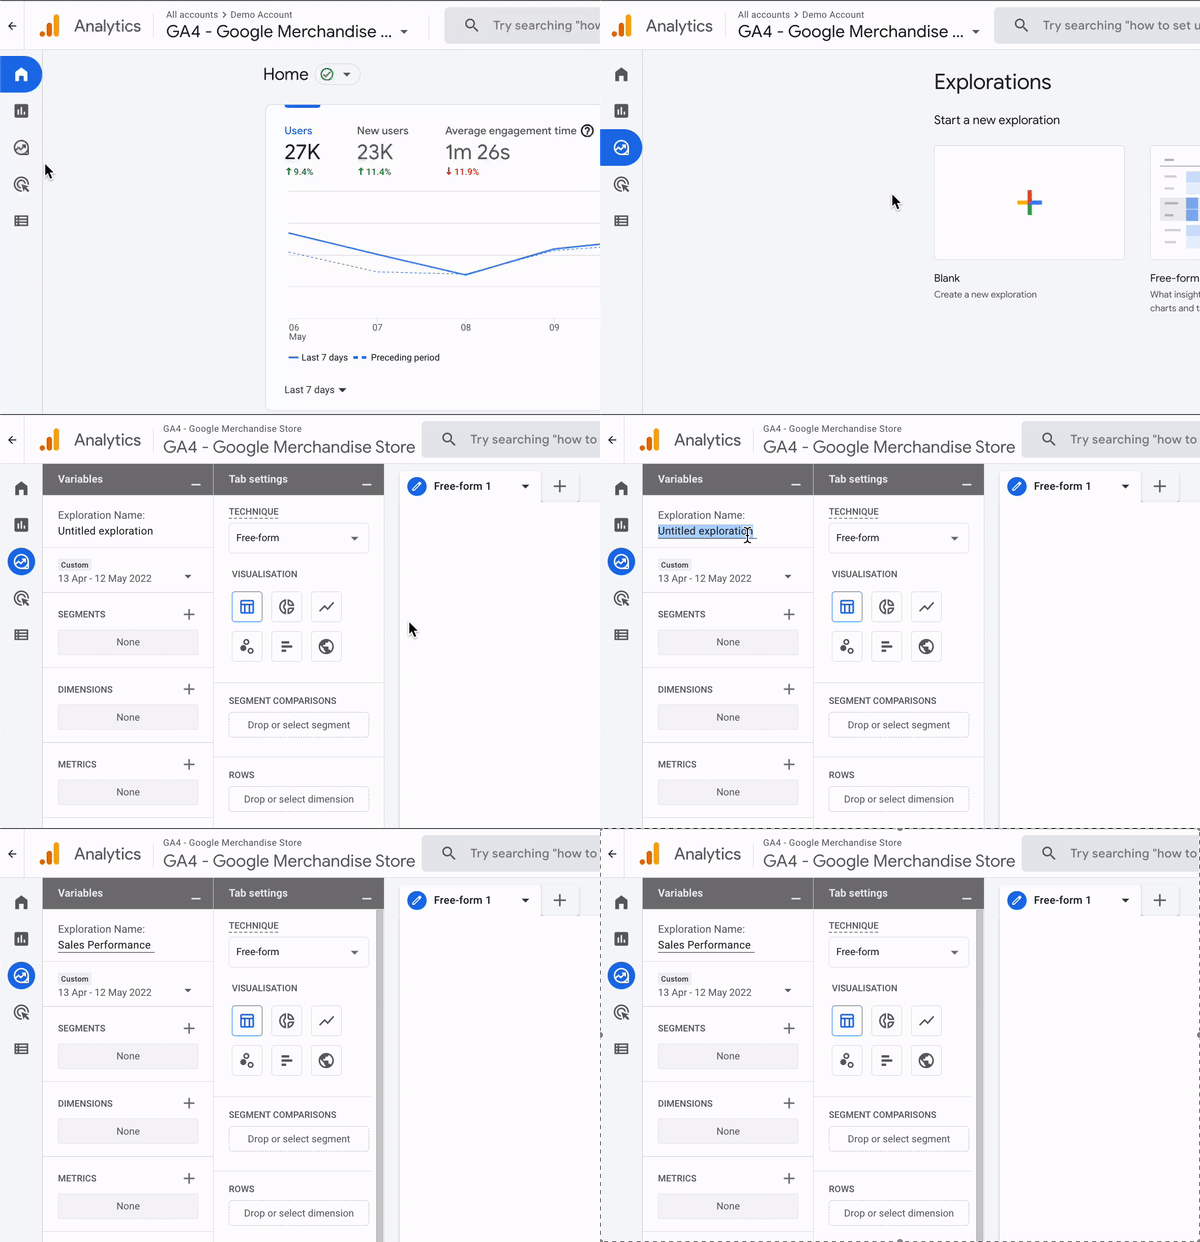
- Open your GA4 account and go to Explore. Click + on the Blank exploration tab and create the report. We will name this report 'Sales Performance':
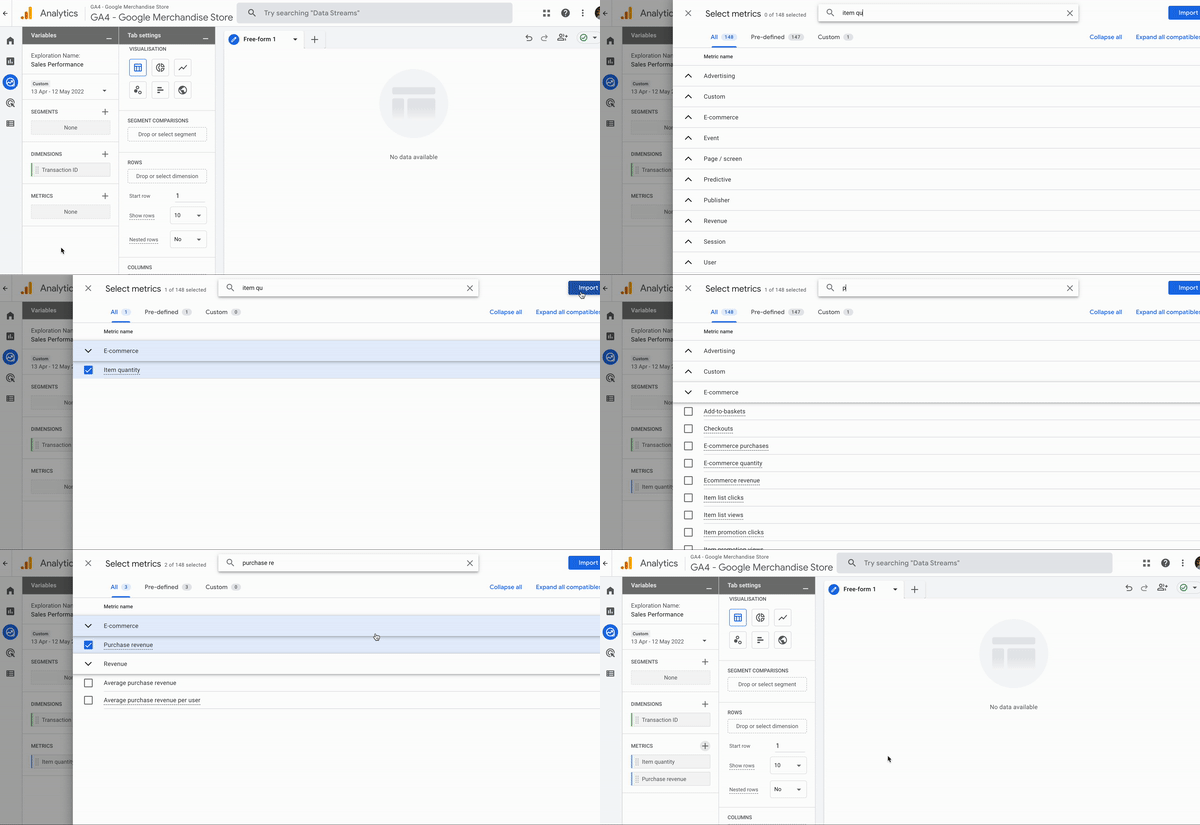
- Add the Dimension. In this case, we'll need the Transaction ID dimension. Click + on the Dimensions tab, search for Transaction ID and click Import:

- We will repeat the same steps for our Metrics; in this case, add the Purchase Revenue and Item Quantity metrics:
Add custom metrics and dimensions
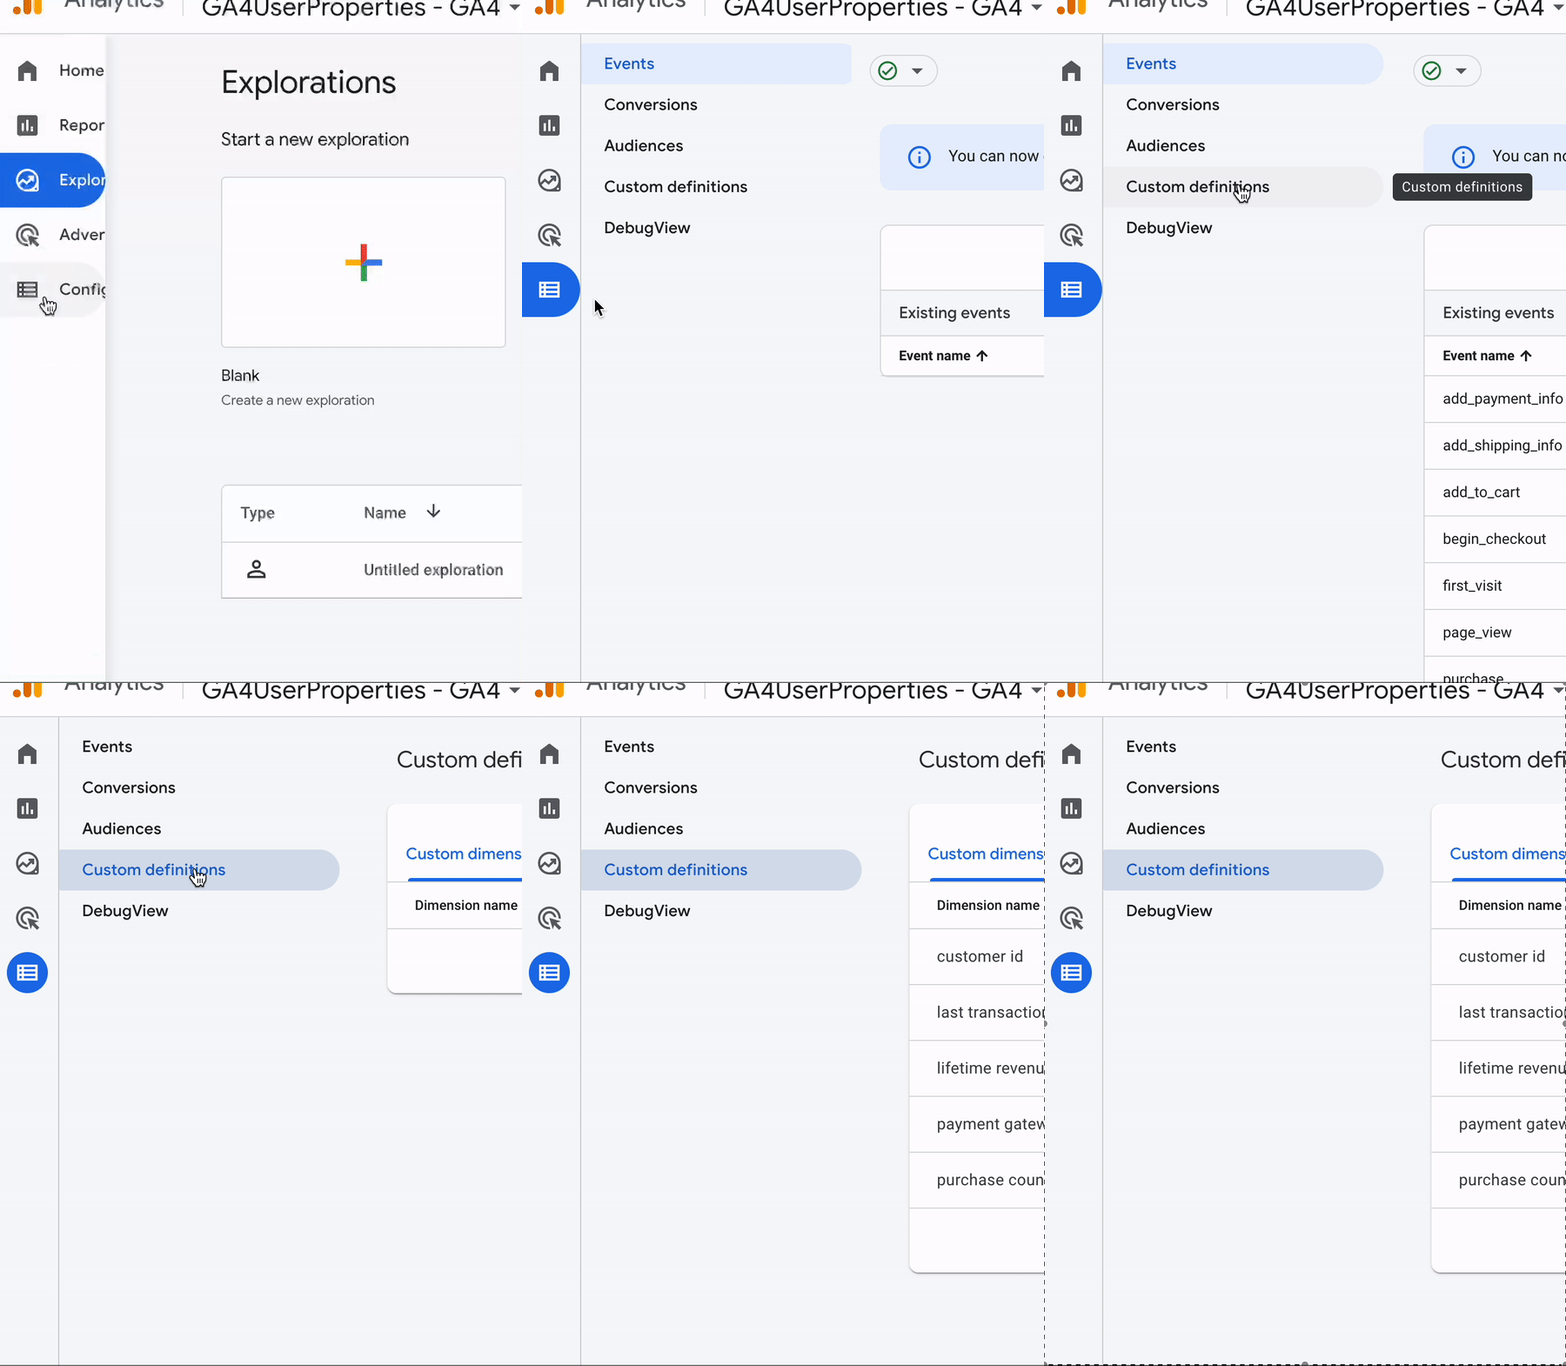
- To add the Shipping and Tax metrics we first need to create them as custom metrics. Open the Configure tab on the left and select Custom Definitions:
- Then hit Custom metrics and Create custom metrics button**:**
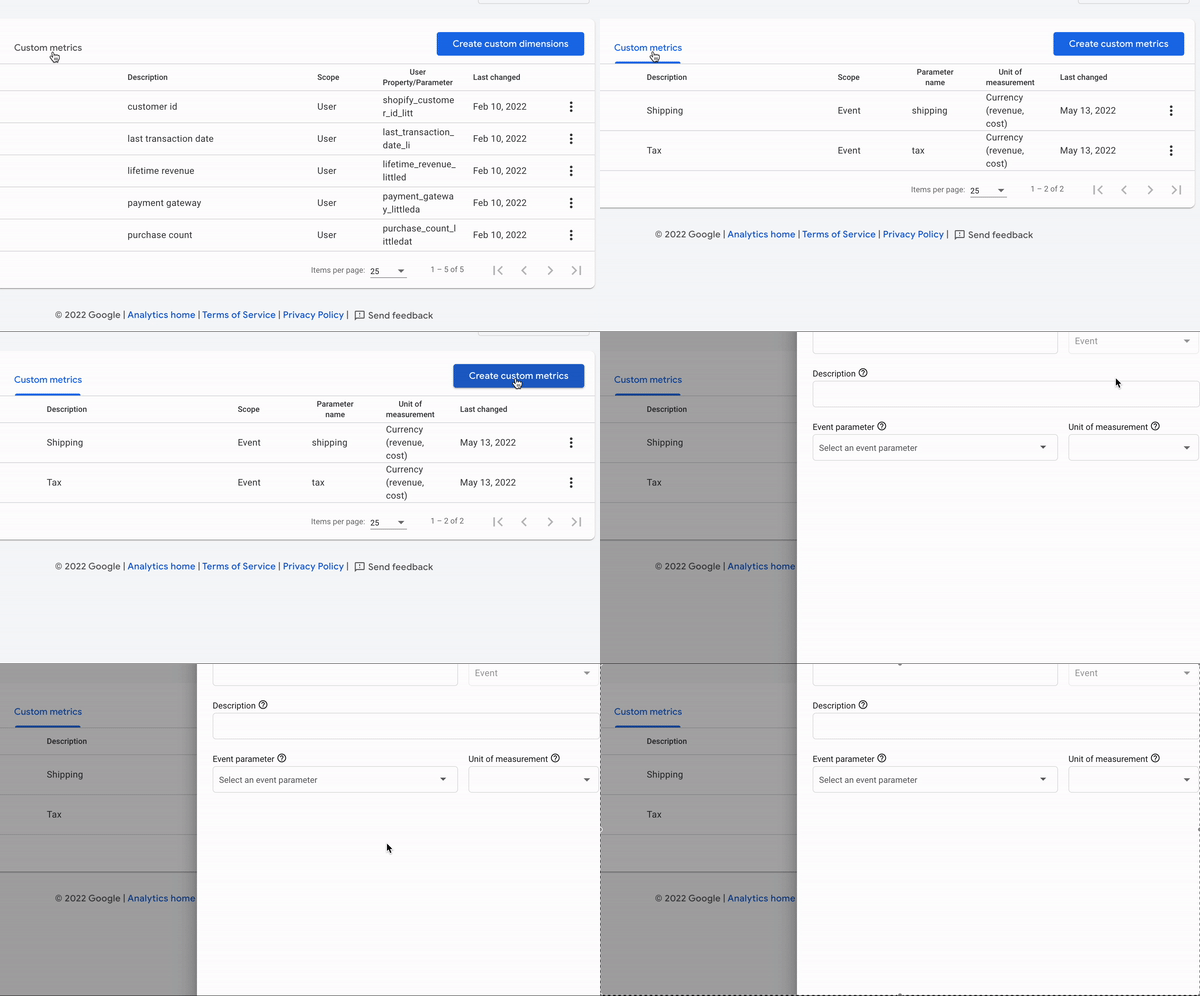
The configuration for both metrics should look like this:
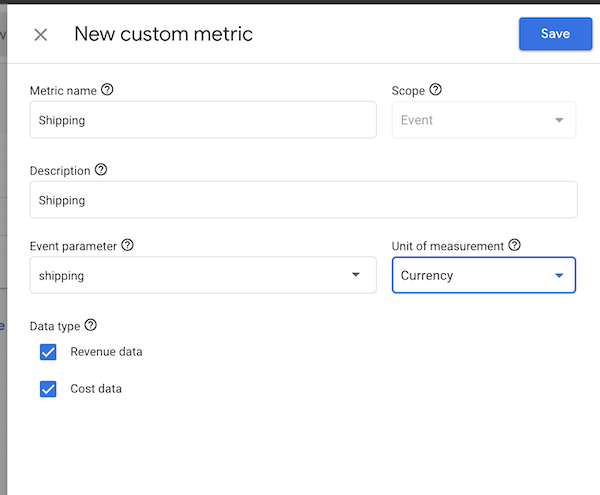
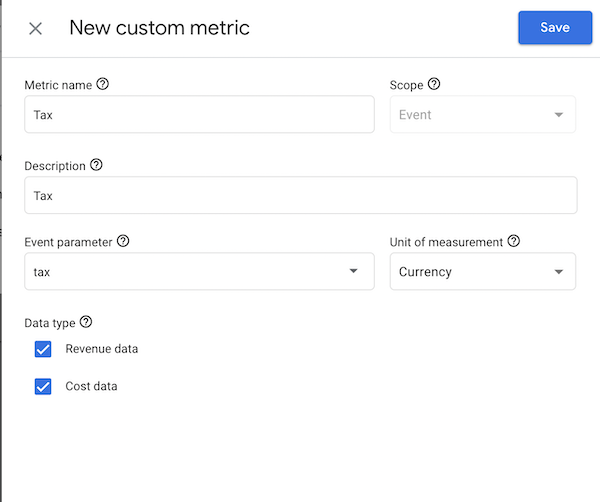
- After importing the desired dimensions and metrics, simply drag the Dimension(s) to the ROWS tab and your metrics to the VALUES tab to populate the report. In the end, the report configuration should look like this:
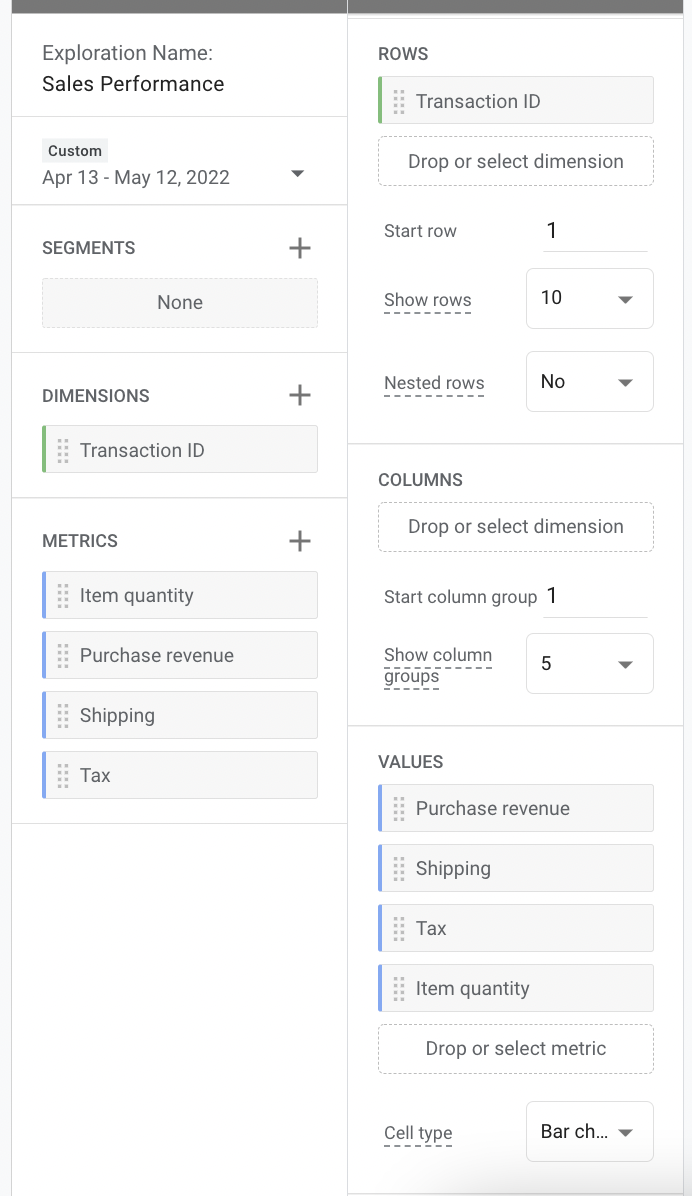
There's a bug with GA4's Item Refund metric which prevents us added refunds column to the report. We hope Google can fix this soon.
Alternative - Looker Studio report
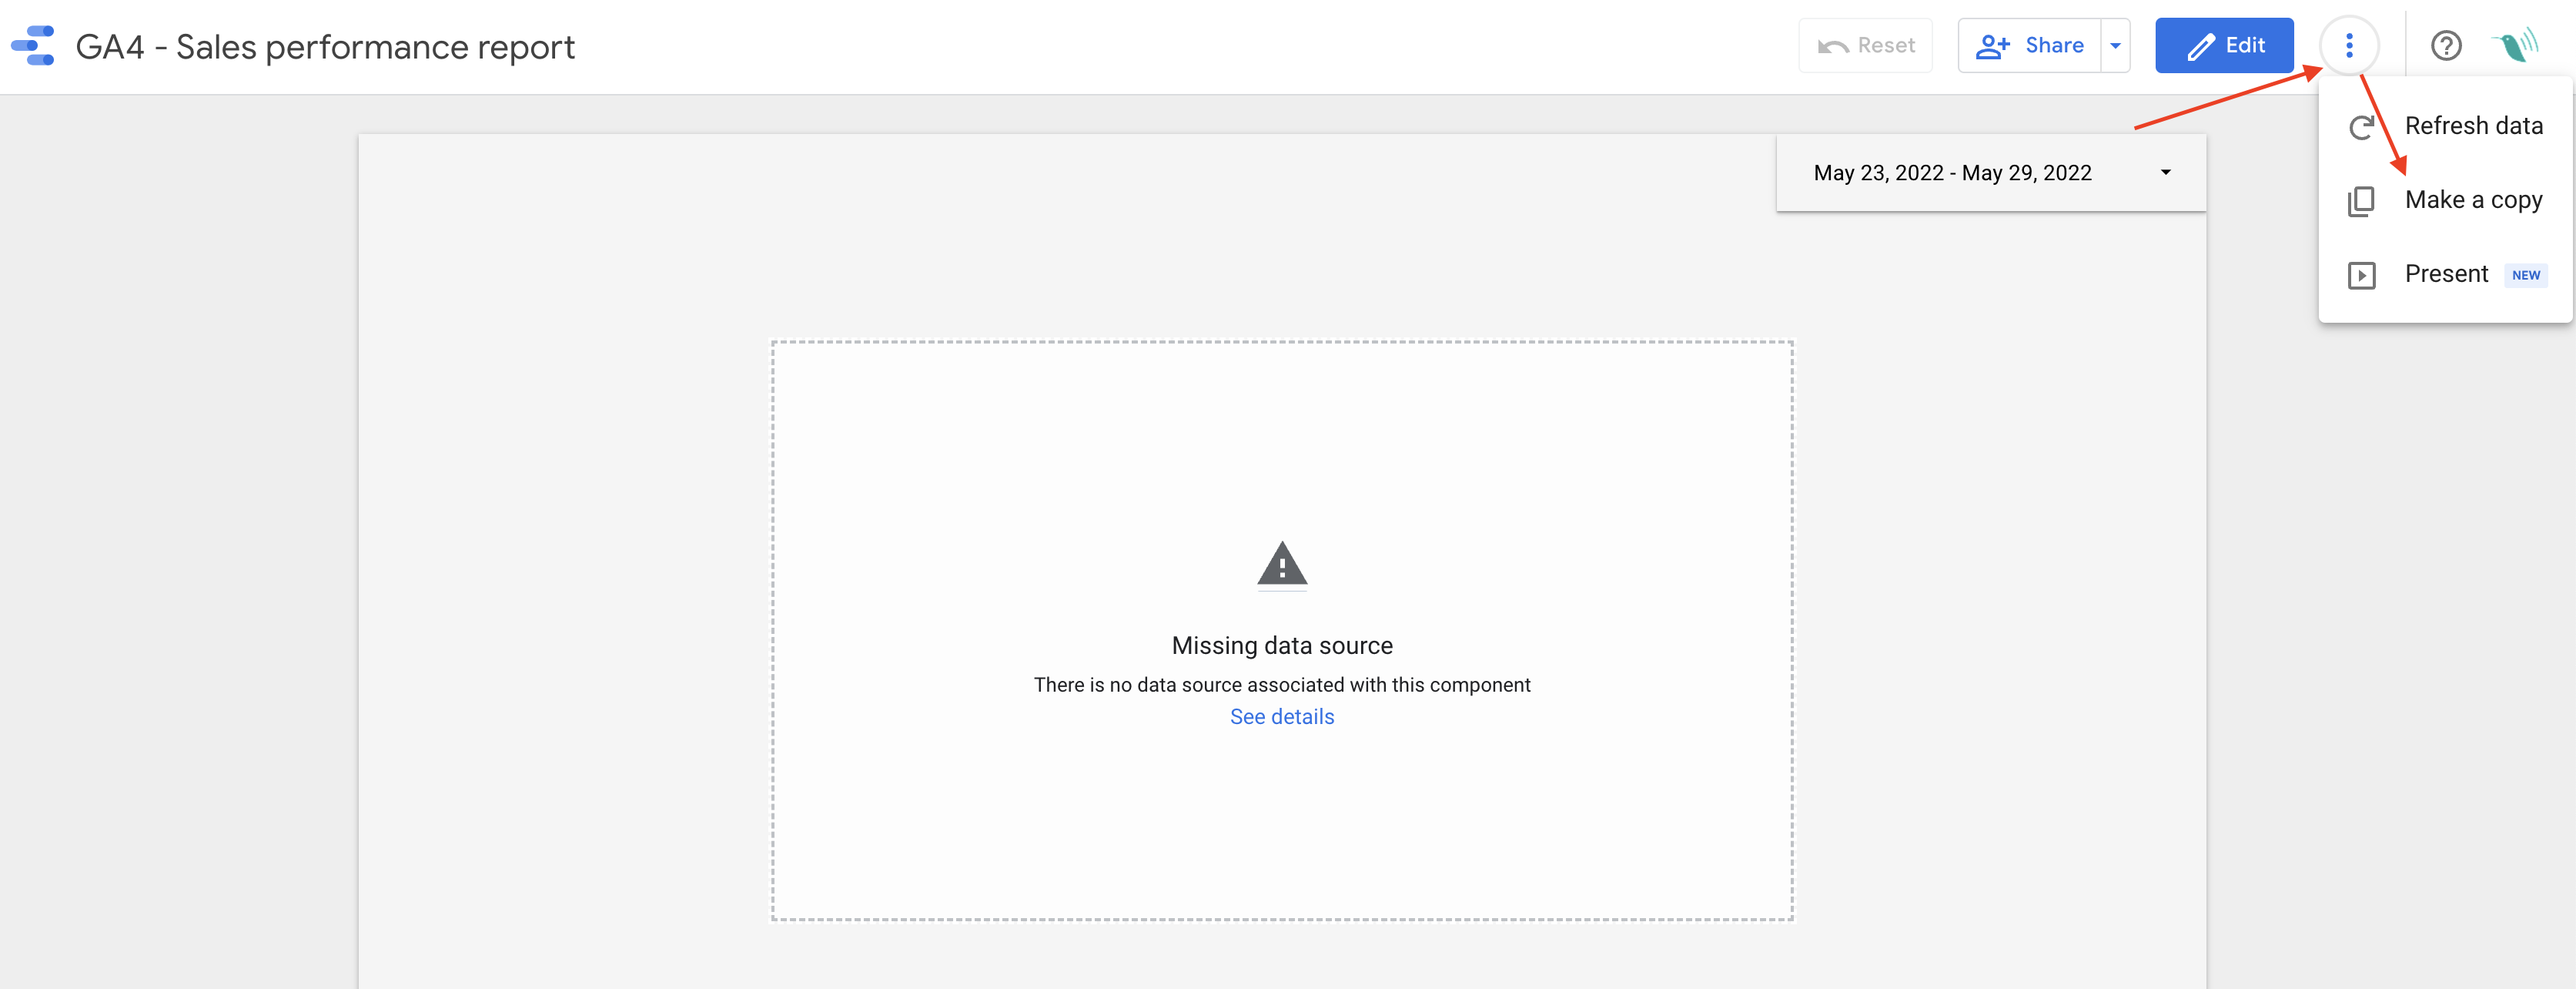
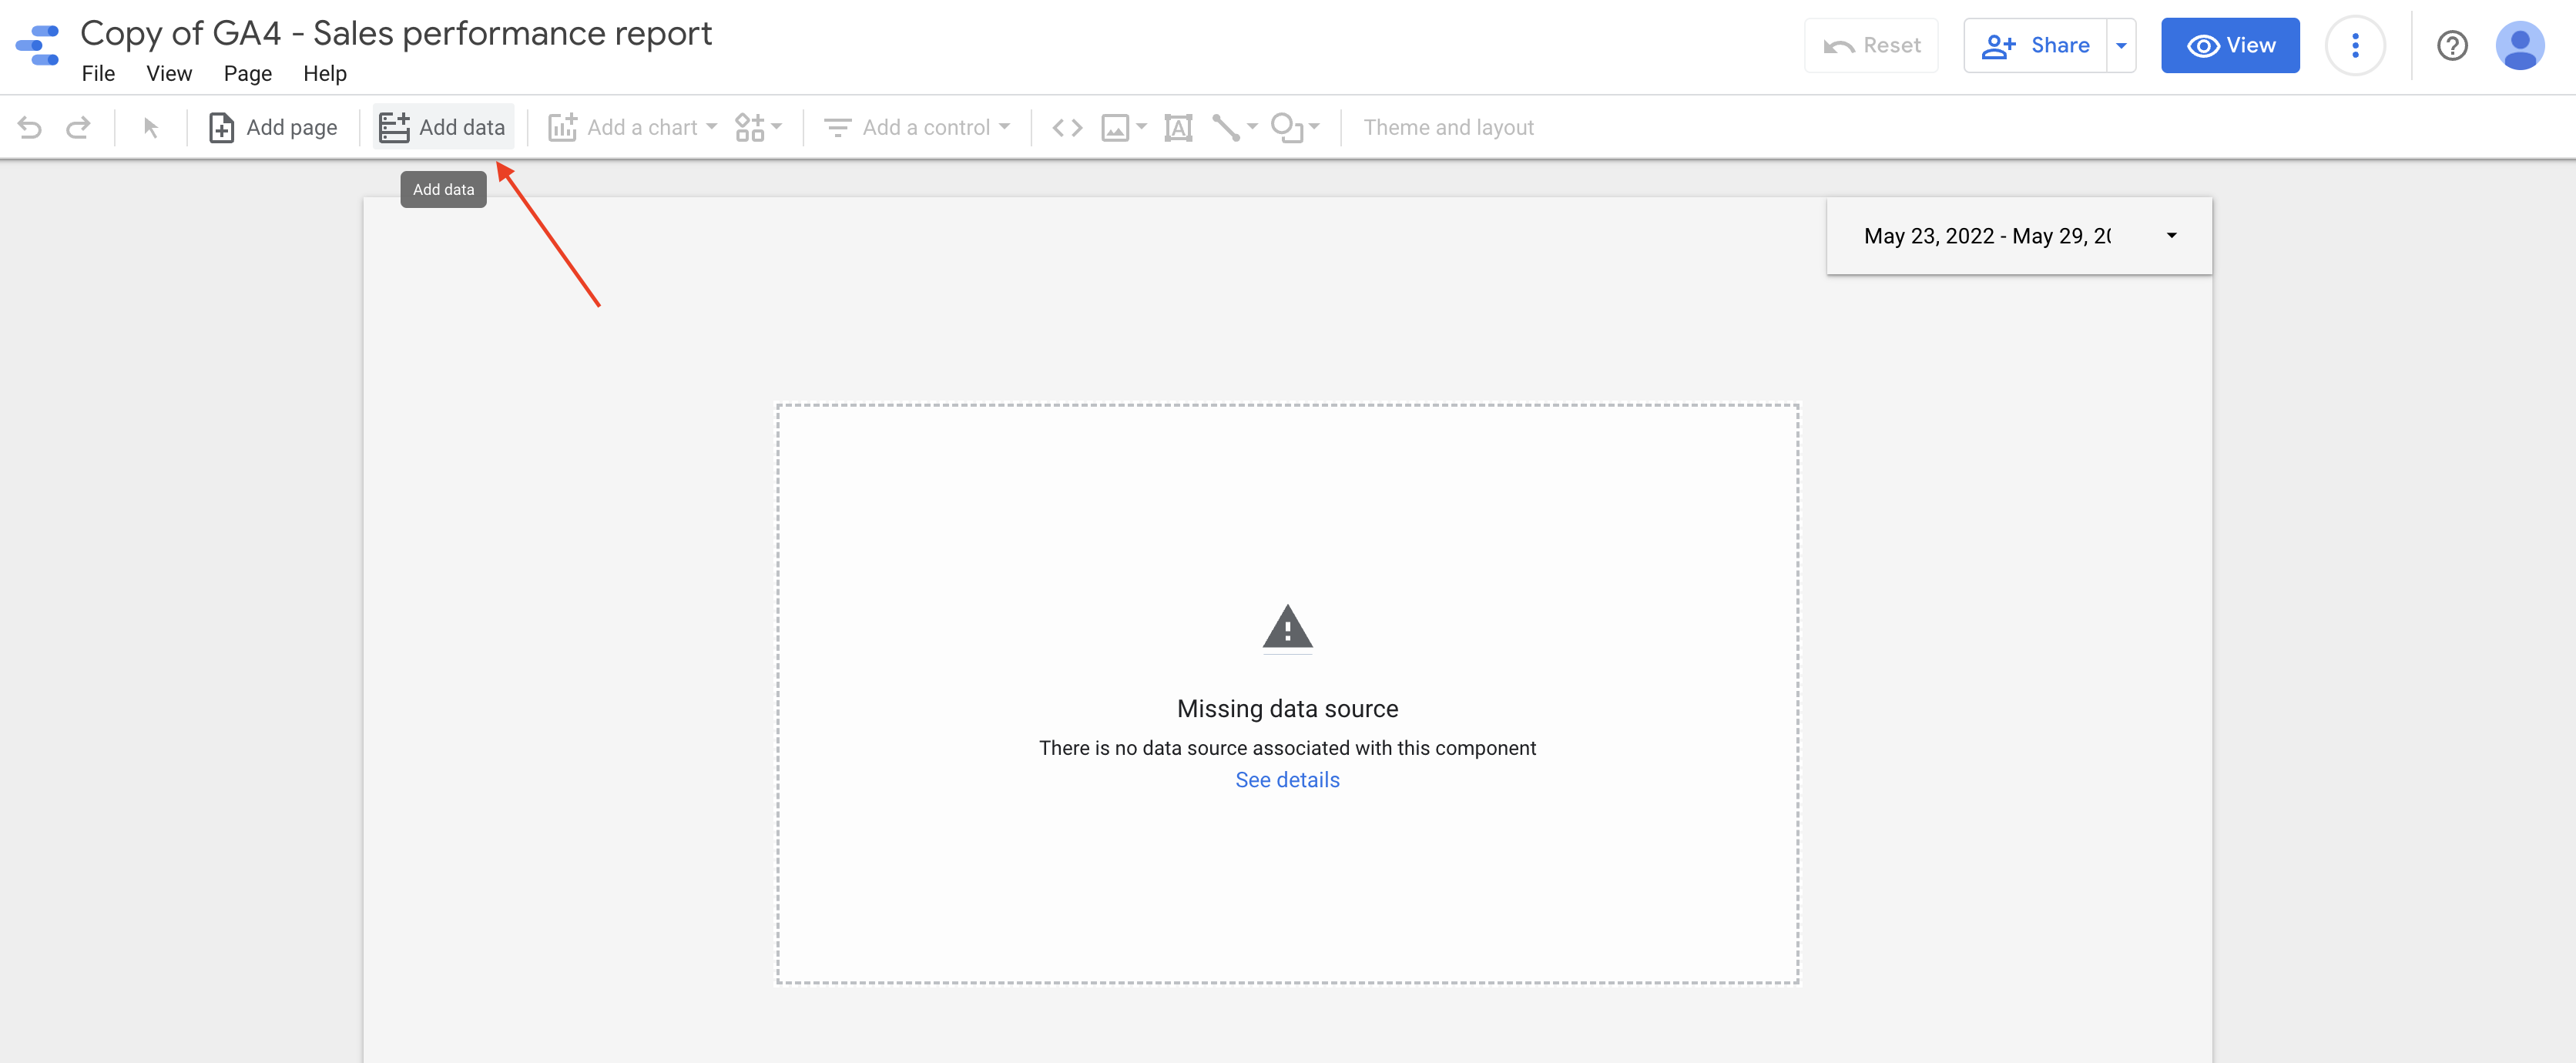
As an alternative to GA4's Explore reports, we've set up a Sales report template in Looker Studio. It can be found here. Do not worry if you are seeing the message "Missing data source". If you will follow the next steps, the table will be populated with data from your GA4 property.
For the Looker Studio report to work properly, you must first add the custom metrics in GA4 (Tax and Shipping) by following the steps previously described previously.
Make a copy
The first step is to make a copy of our Looker Studio report. This way you will have one of your own which will be editable as you wish:
Add a data source
- In your copy, add a data source. The data source will represent the GA4 property that contains the data you want to use for the report"
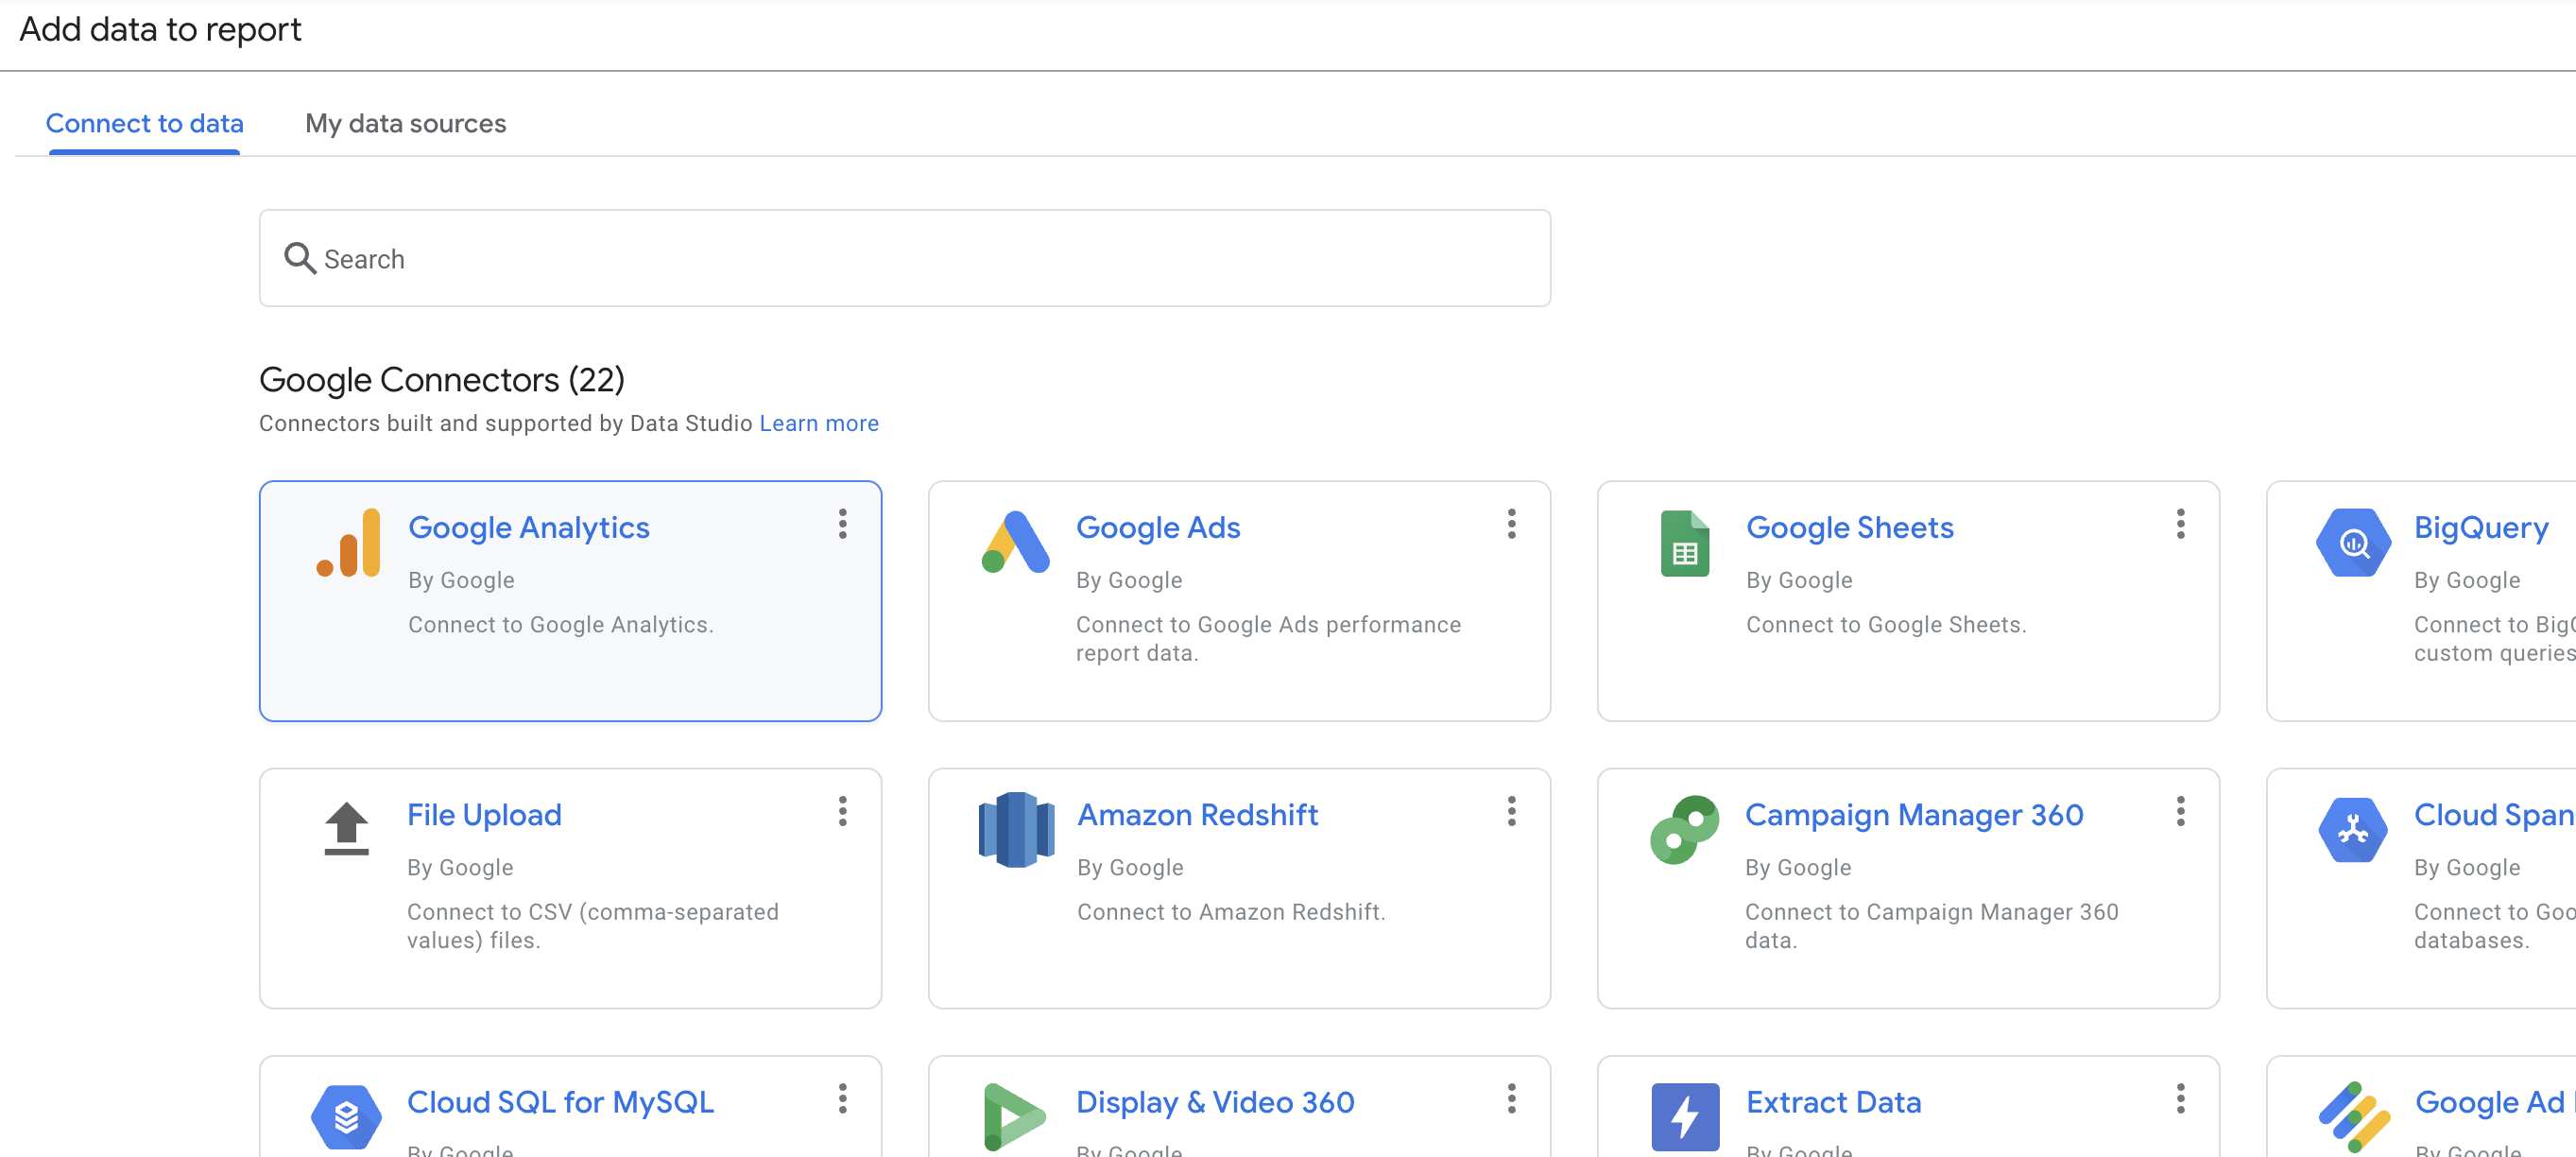
- Select the Google Analytics connector:
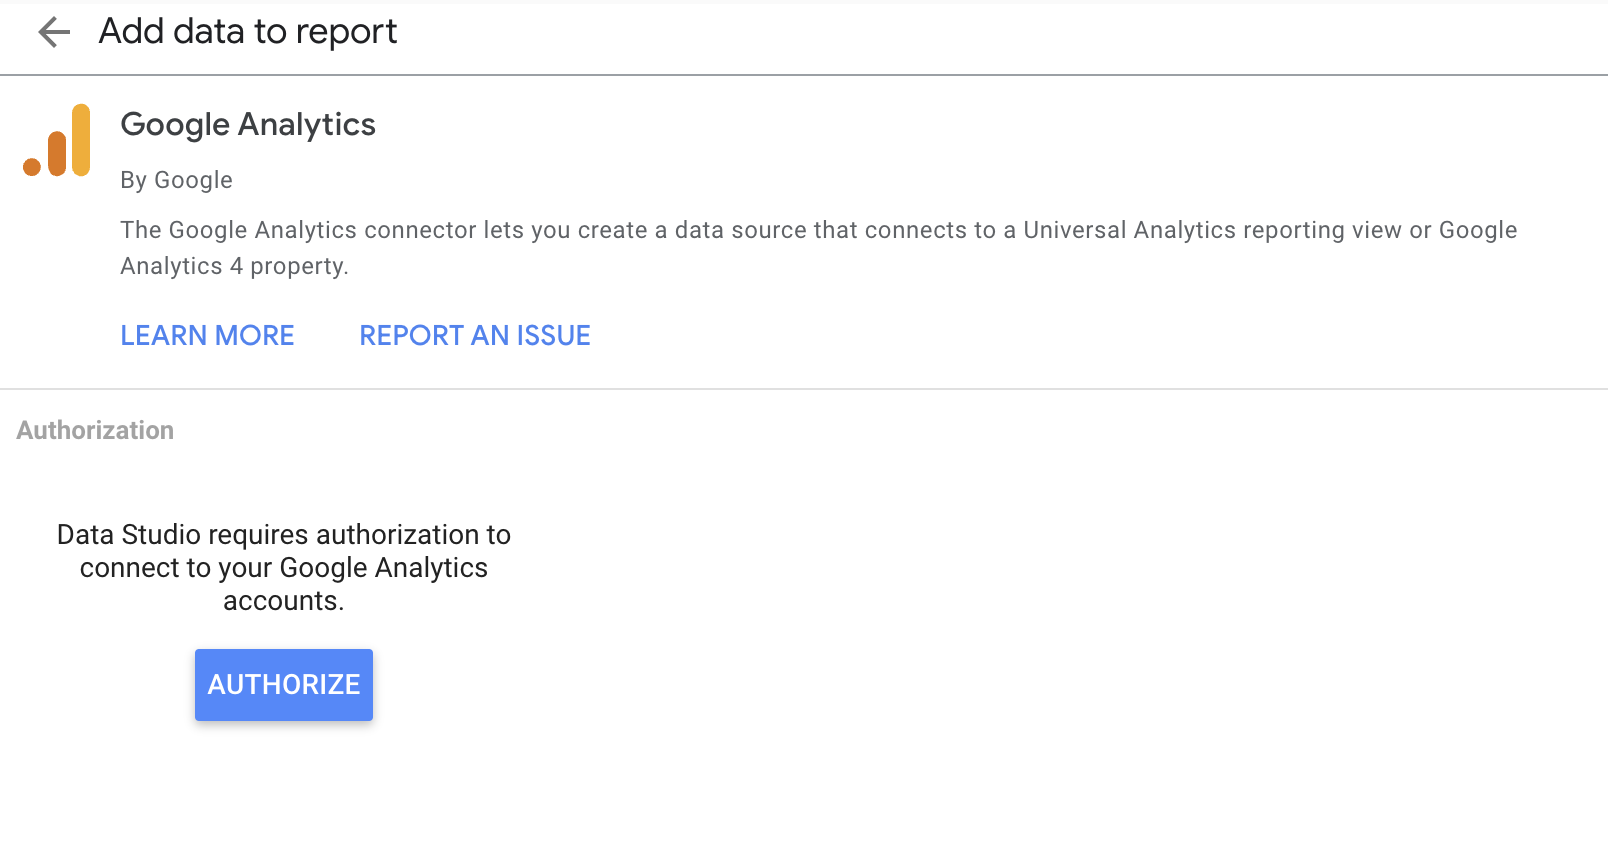
- If prompted, press "Authorize" to be able to see the Google Analytics accounts and properties to which you have access (make sure you are logged in with the same account you are using for Google Analytics):
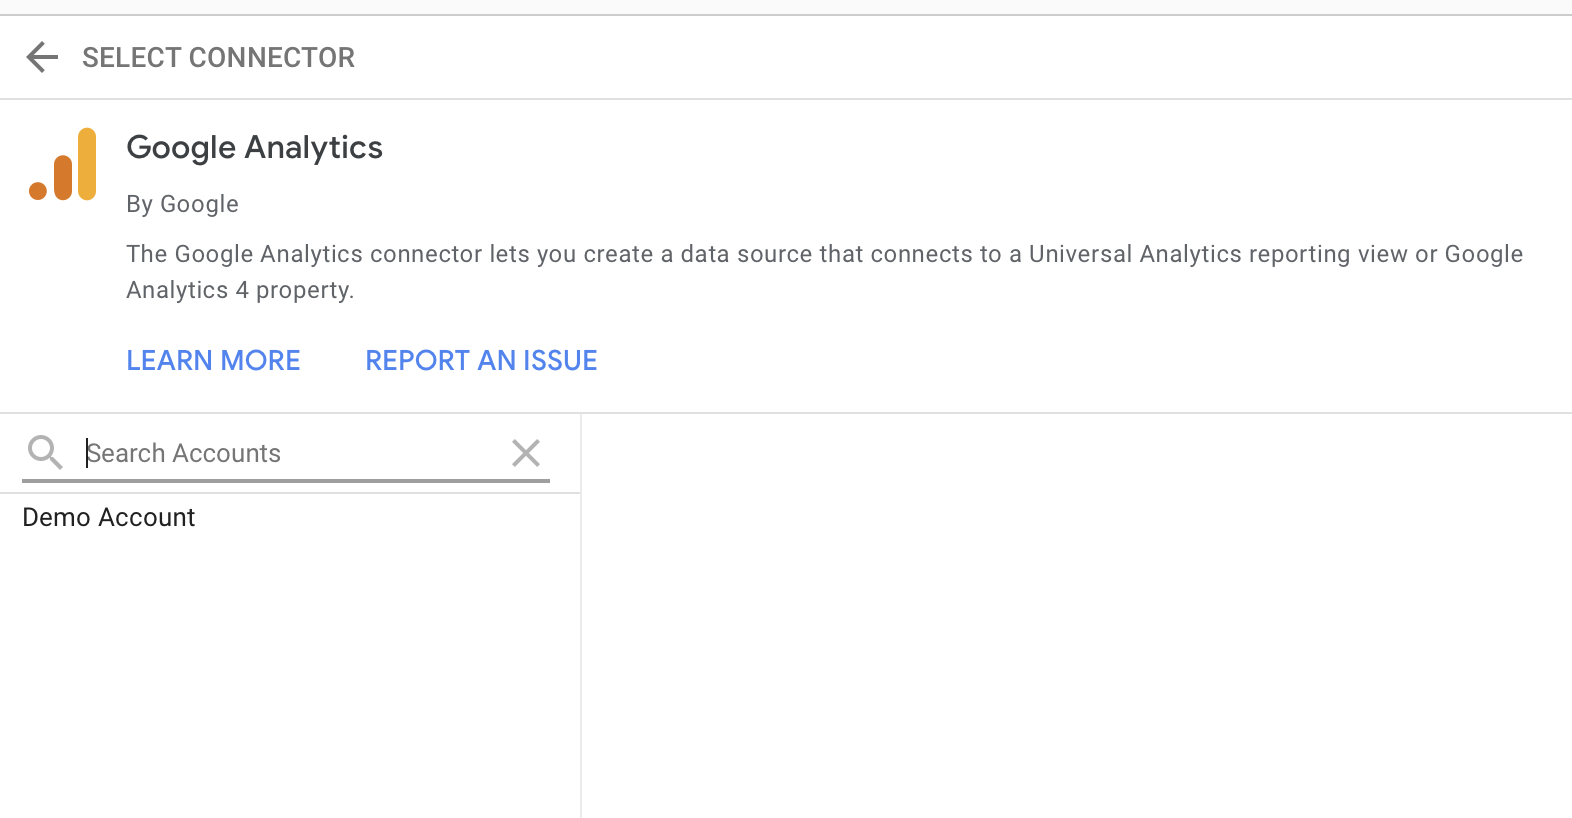
- Selected the GA4 property and click "Add" which can be found in the bottom-right corner:
Add the data source to your table
- Select the table and the add the data source:
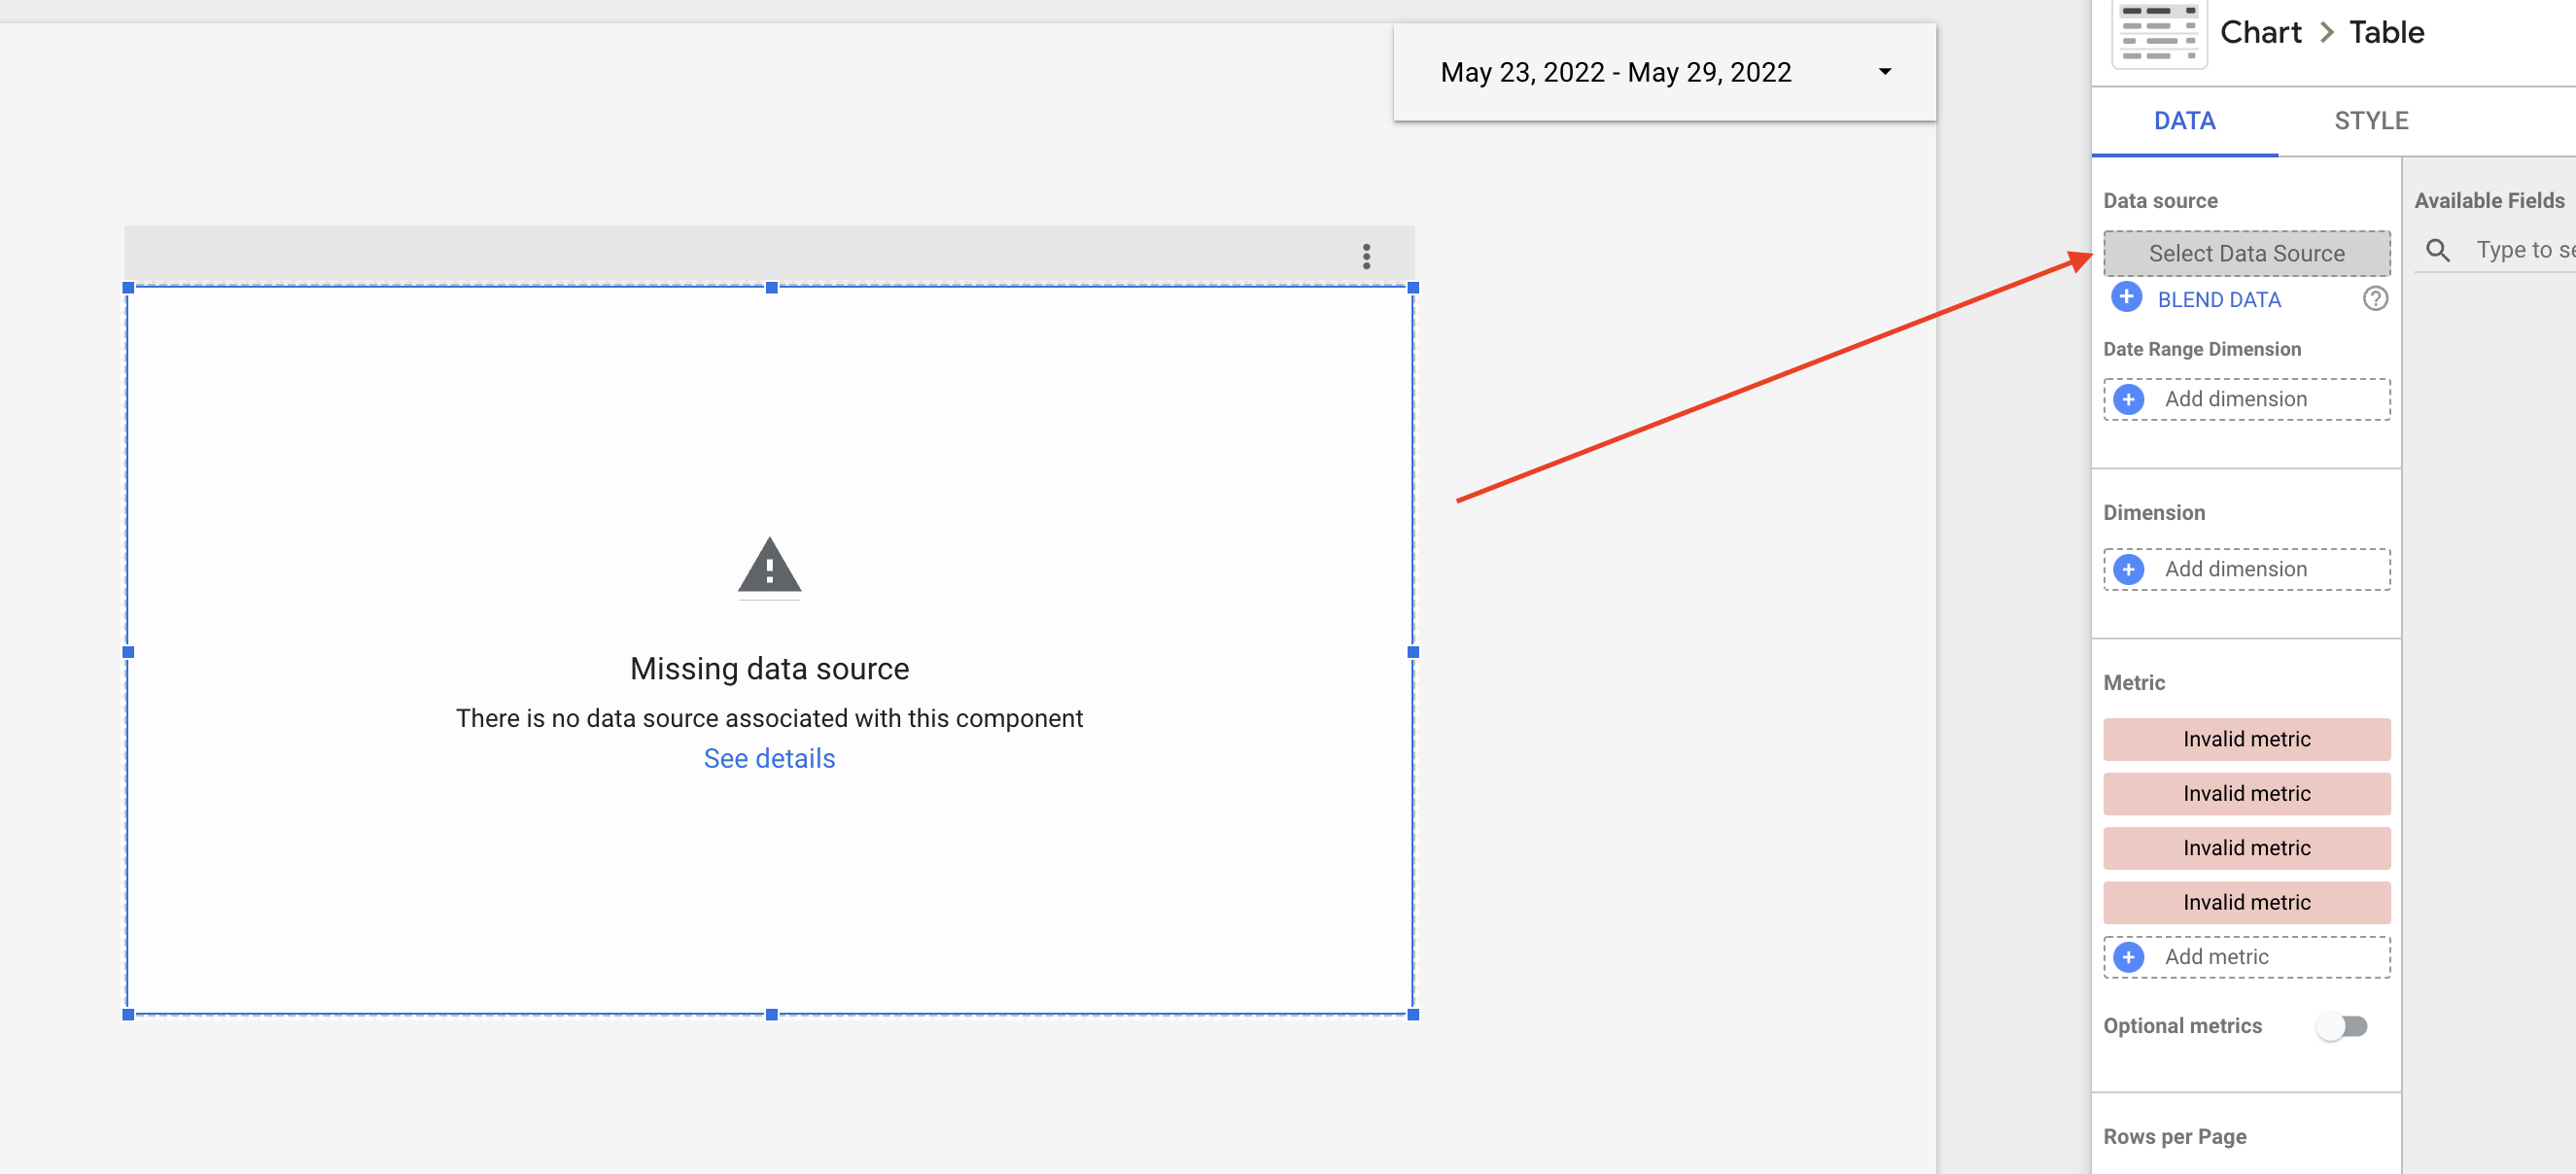
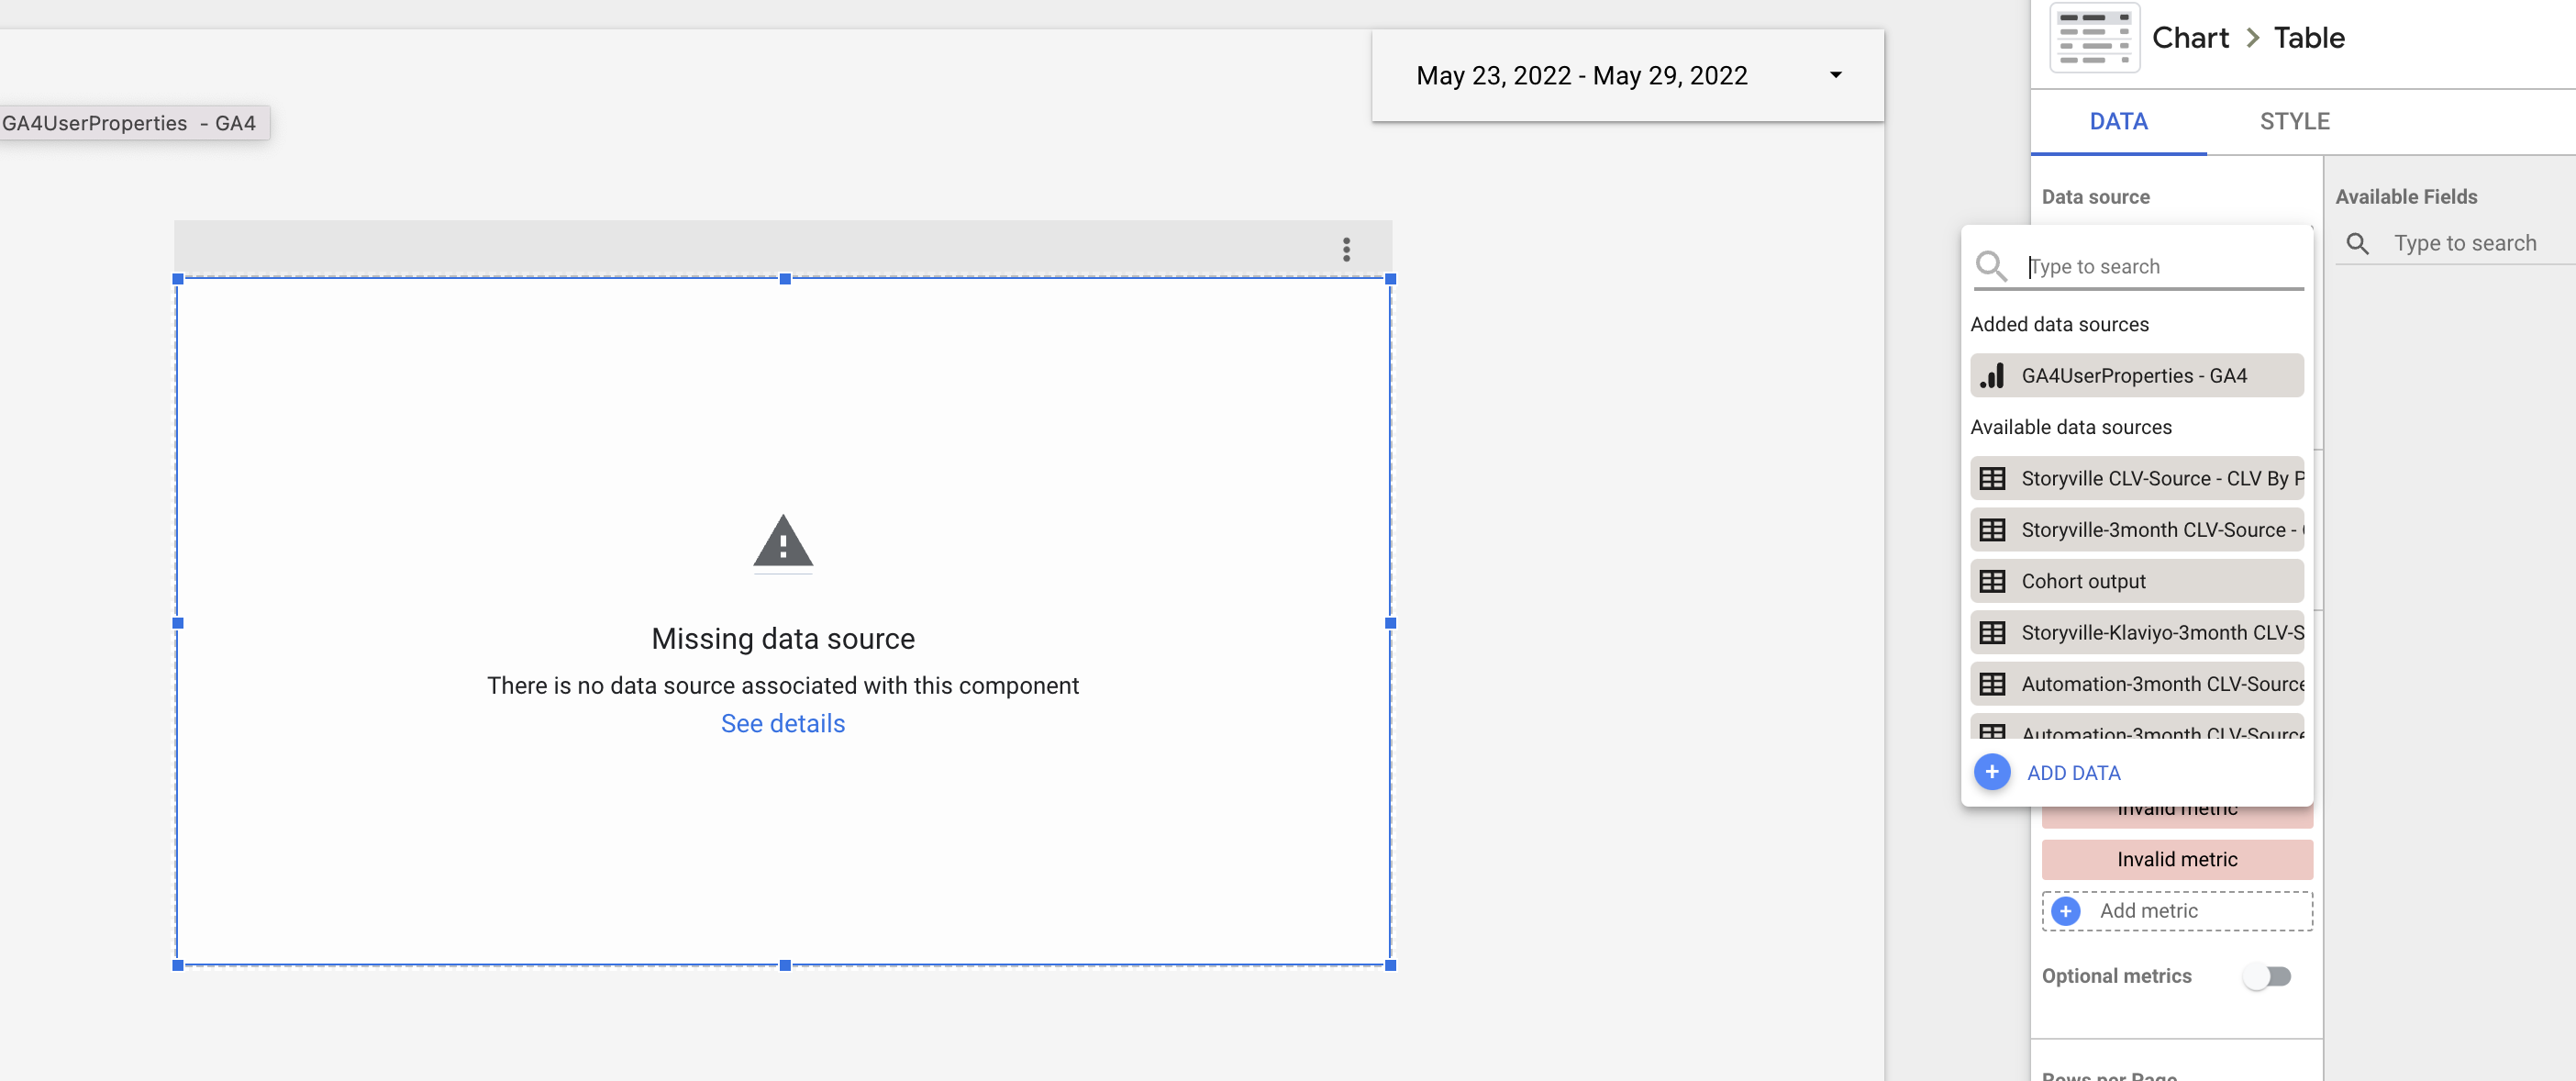
- Once you select the data source, the table will be populated with your data:
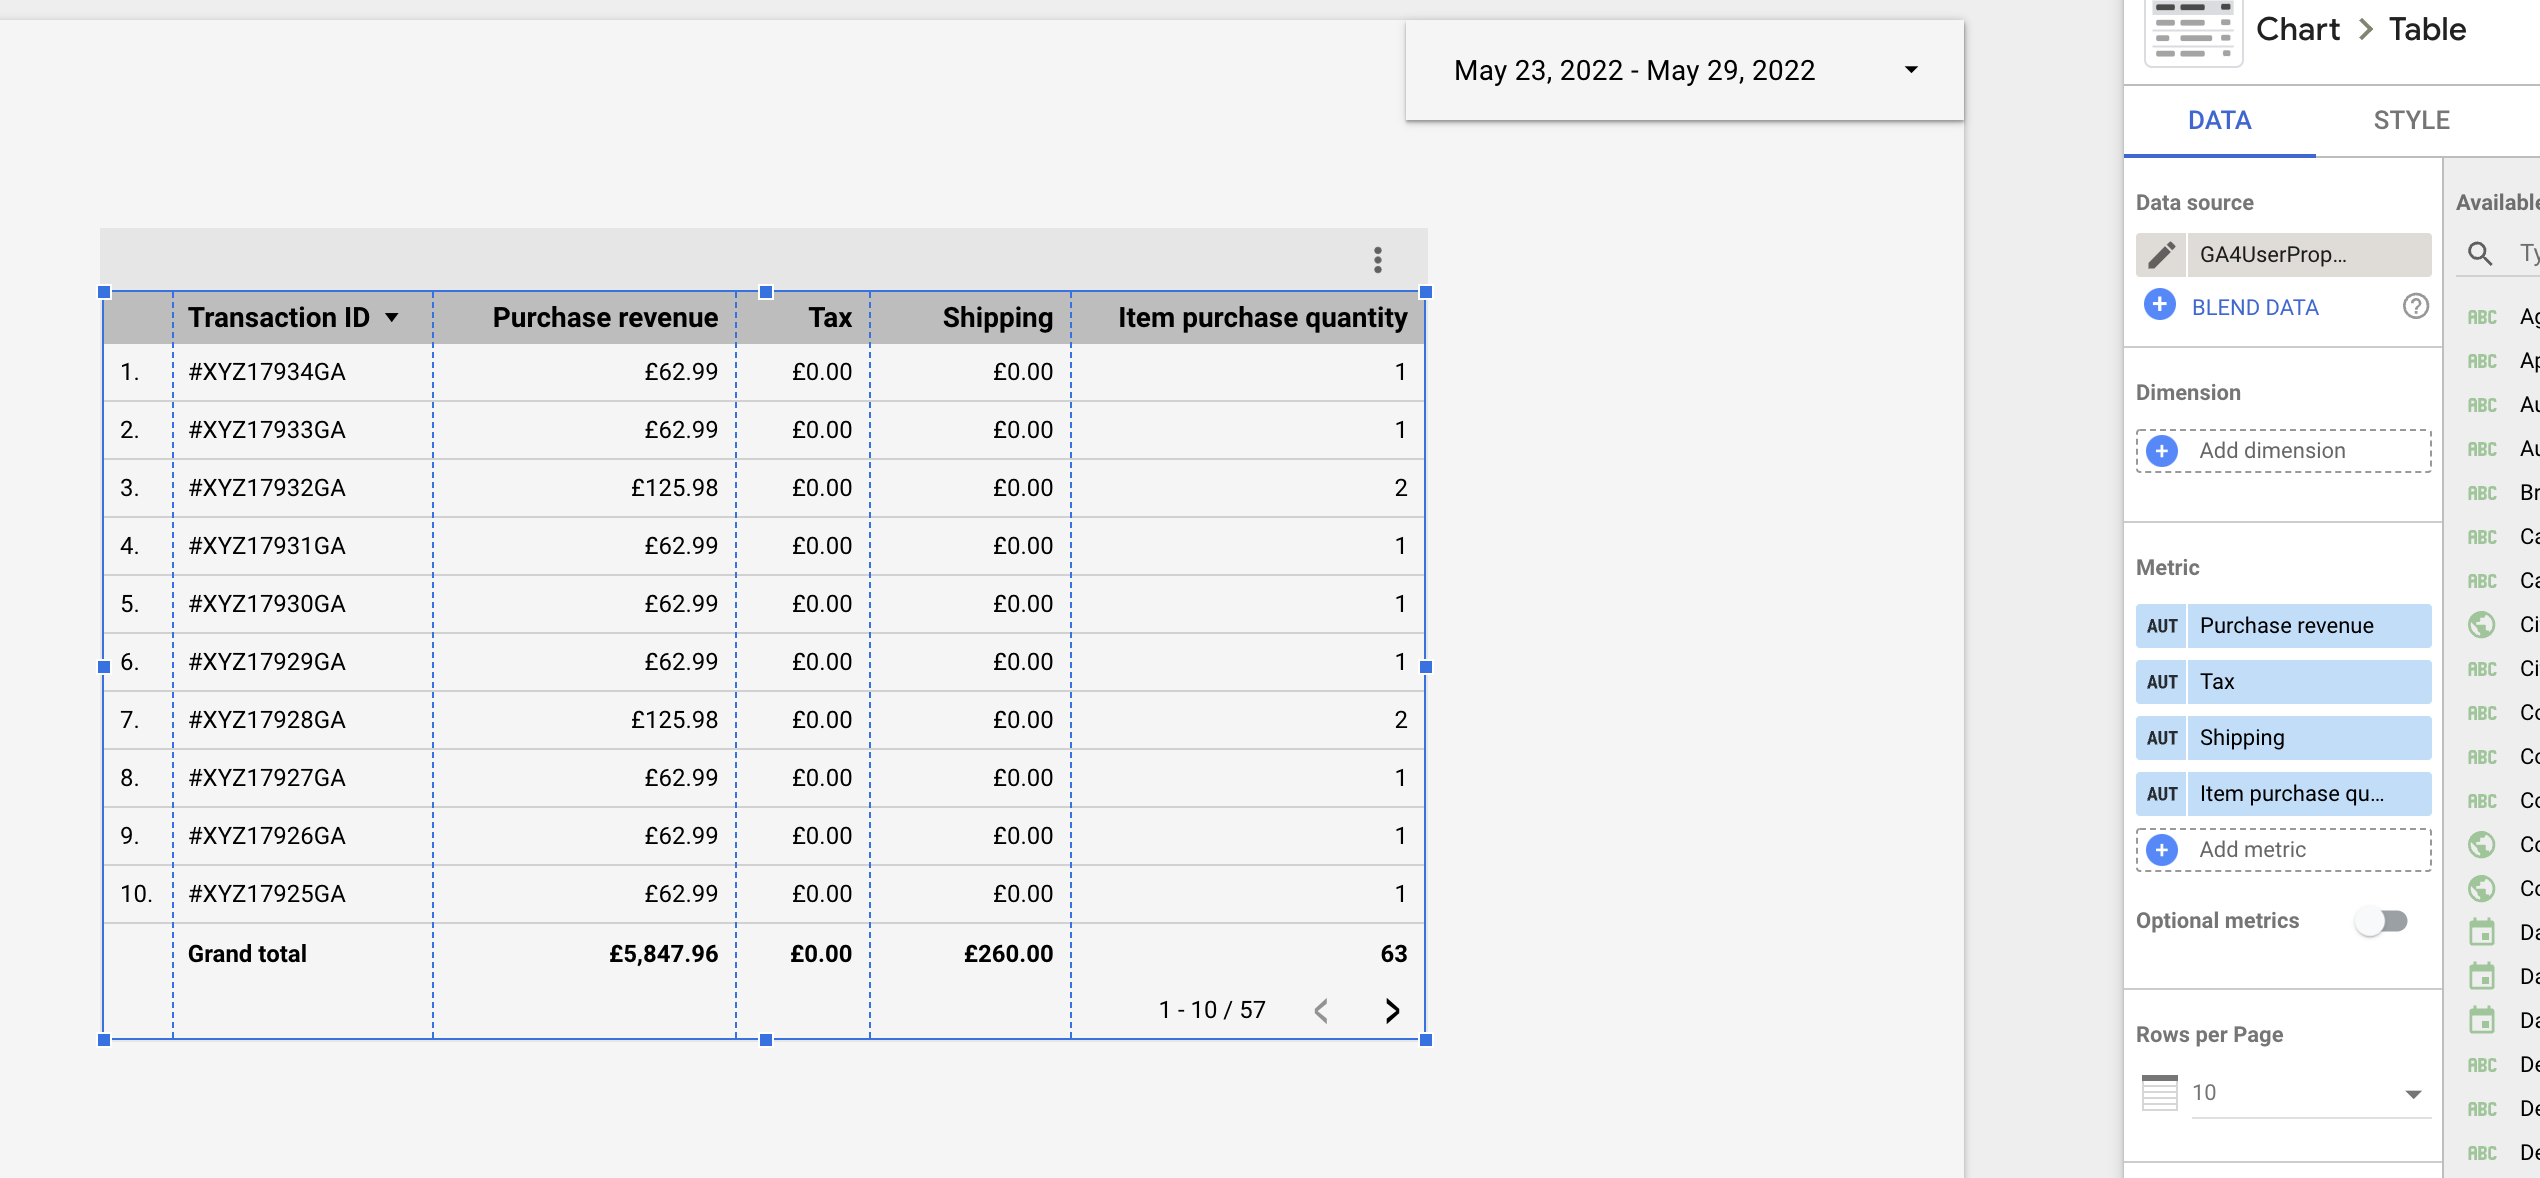
You're all done! Now you can get the same sales performance reports in GA4 or Looker Studio that you relied on in Universal Analytics.