Conversion rate in Google Analytics 4
What is a Key Event?
Formerly known as conversions, GA4 "key events" reveal the actions that drive business success, offering insights into how users interact with your site or app.
Key Event Rate: Understanding the Metrics
GA4 introduced two types of key event rates (previously known as session/user conversion rate):
- Session Key Event Rate: The percentage of sessions that converted. This metric is calculated by dividing sessions with at least one key event by the total number of sessions.
- User Key Event Rate: Unlike the session key event rate, this measures the percentage of users who complete a key event at least once, regardless of how many sessions they have.
For example:
- Session Key Event Rate: If a user visits the site twice, with one of those visits leading to a key event, you have a 50% session key event rate.
- User Key Event Rate: If that same user completes a key event in one session, they’ll still be counted as a “converted” user even if they visit again without completing another key event
Session key event rate
The session key rate in Google Analytics is:
Session Key Event Rate = (Number of Sessions with key events / Total Number of Sessions) x 100
The session key event rate won’t match if you divide the number of key events by sessions because the formula is based on the number of sessions with key events. And key events will account for all the events marked as key events.
The key event rate could be used in calculating the product conversion rate - how many users need to see a product before one of them decides to buy it?
For example, if a user triggered two key events in one session it will be counted as two key events, but will only be a single converted session.
Key Event Rate in Standard GA4 Reports
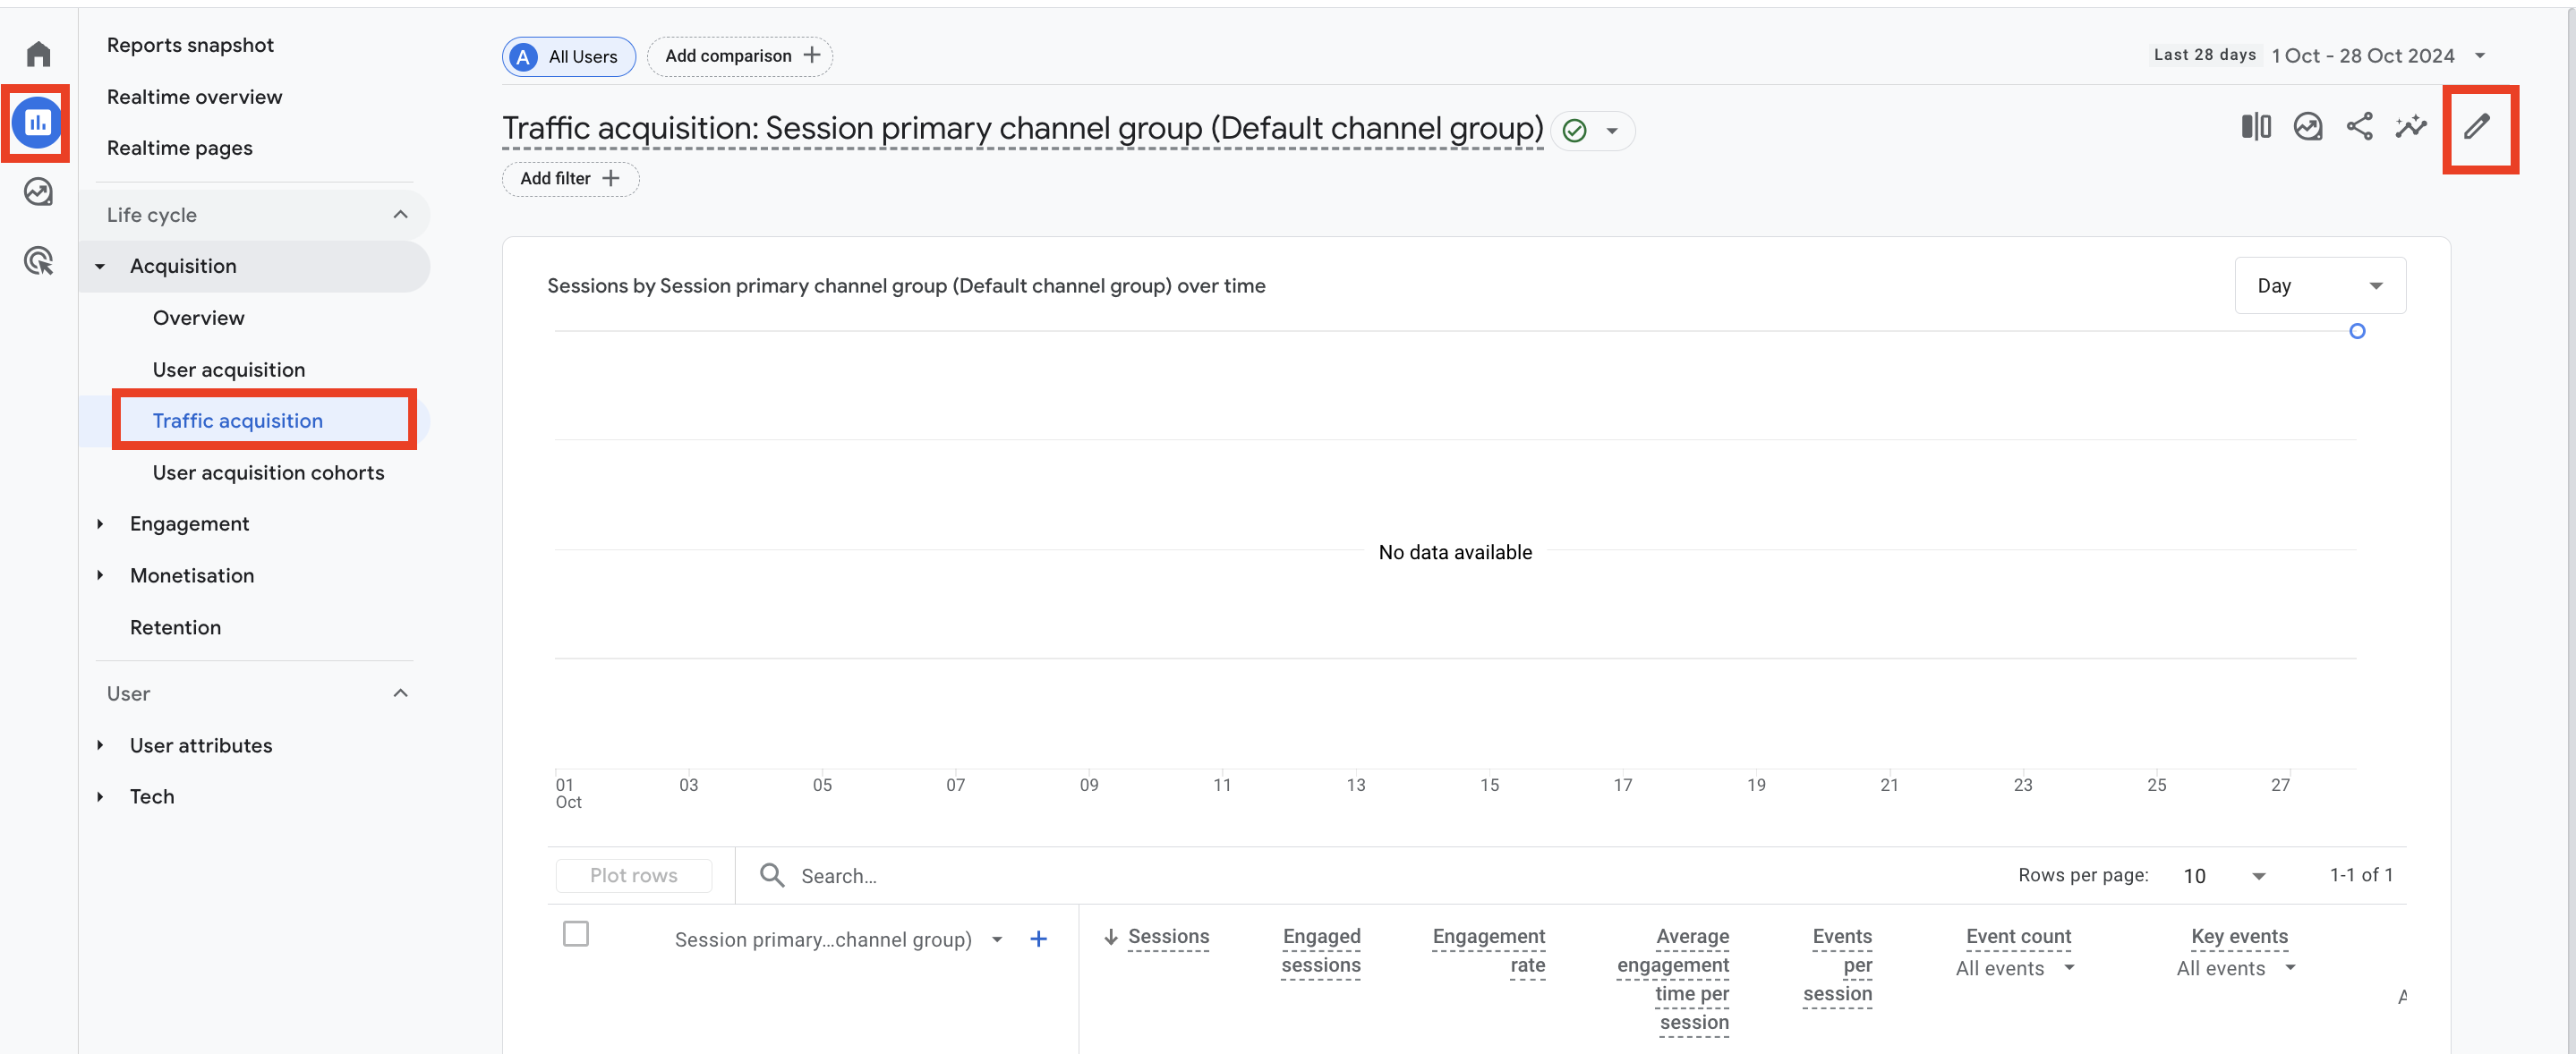
To see the session key event rate in your GA4 reports:
1.Go to Reports > Acquisition > Traffic Acquisition.
2.Click the pencil icon in the top-right corner to customize.

3.Under Metrics, add “Session Key Event Rate” to view it within your report.

The user key event rate can be added the same way and provides a user-based view of conversions rather than a session-based one.
Make sure you select the purchase event in the dropdown under the session key event rate if you want to view the conversion rate for this particular event.
Creating a Custom Exploration in GA4
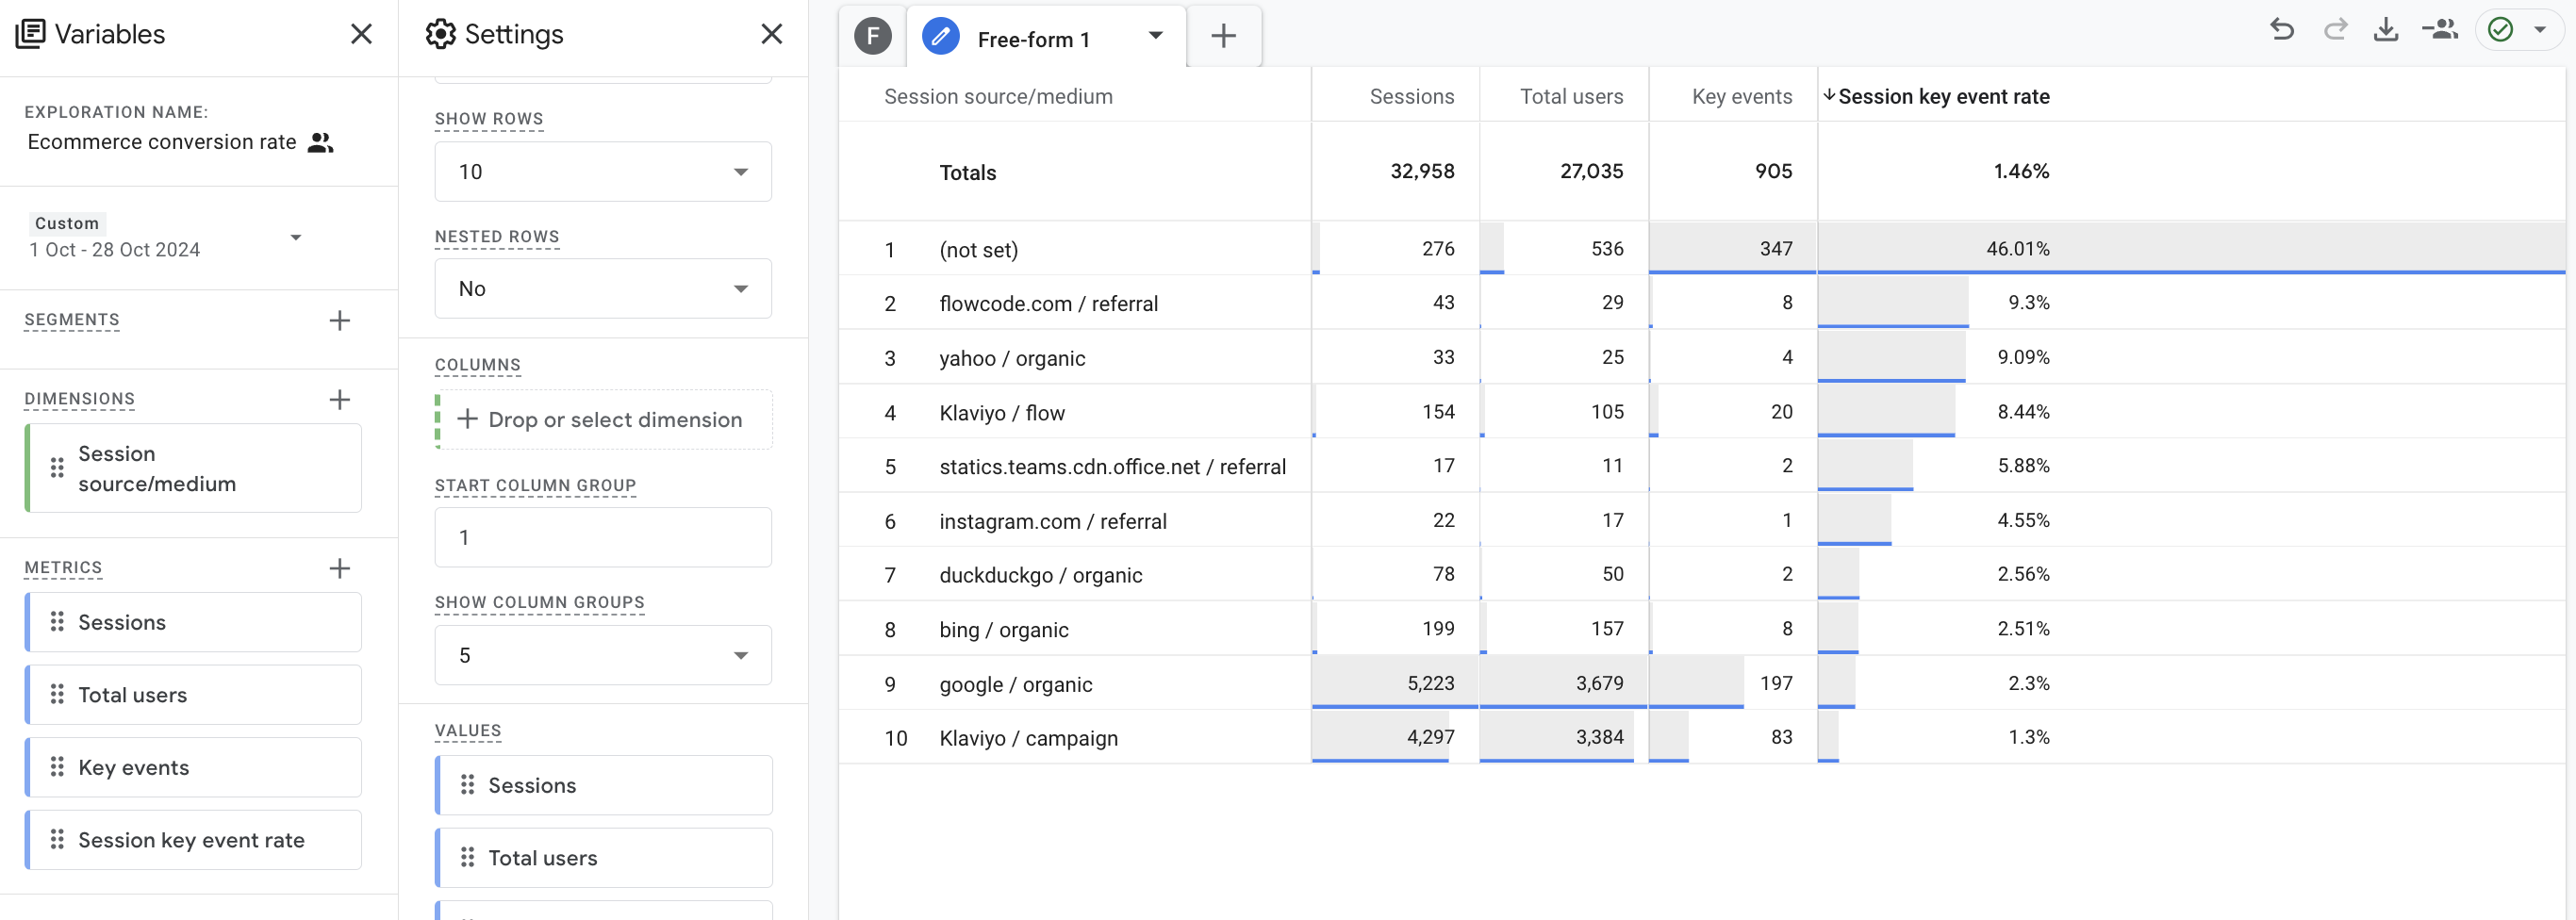
For more detailed insights, you can build a custom exploration to see how specific traffic sources and mediums influence your key event rate.
1.Navigate to Explore > Blank to create a new report.
2.Add Dimensions like “Session source/medium.”
3.Add Metrics such as “Sessions,” “Total users,” “Key events,” and “Session key event rate.”

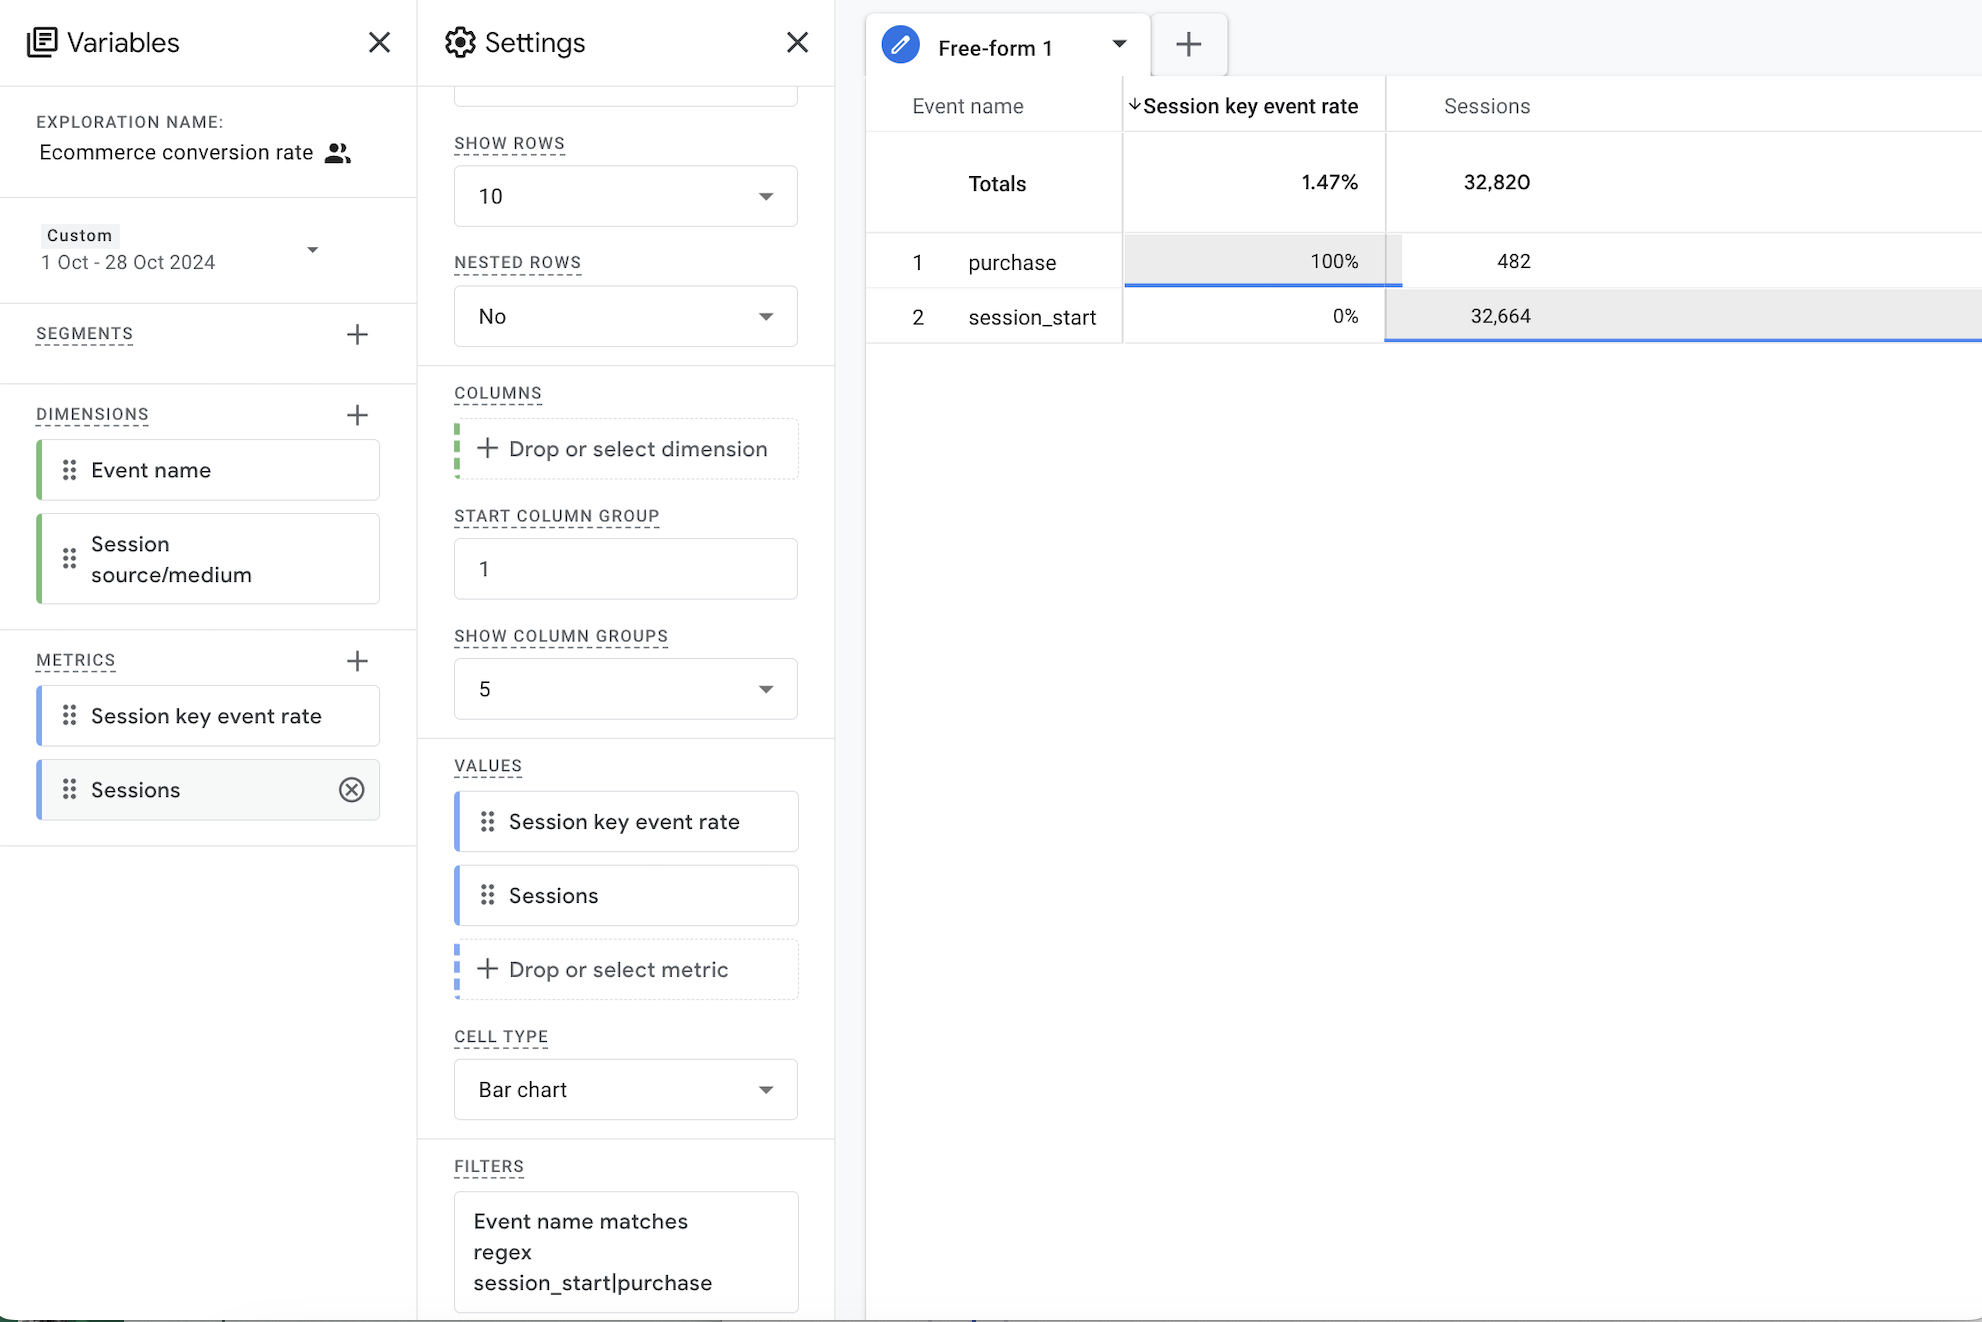
- Filter the data to focus on specific events, if needed (e.g., only “purchase” events). Filter pattern: Event name matches regex session_start|purchase.

This will ensure that only the purchase event is counted as the key event in the key event rate calculation.
Summary: Both the session and user key event rate metrics are essential in understanding your traffic sources, the performance of marketing campaigns and conversion actions.