Shopify reporting in Google Analytics 4
Google Analytics 4 (GA4) is the latest version of Google Analytics, replacing Universal Analytics (UA) - which stopped collecting data in July 2023. With Littledata's server-side tracking, you can send complete sales and marketing data from Shopify to GA4. This article is an overview of the ecommerce reporting you get in GA4. We will keep updating it as more reports become available!
How to connect Shopify to Google Analytics
Just add the GA4 connection in Littledata's app.
You can read more about how the Shopify to GA4 connection works.
Where you can find reports in GA4?
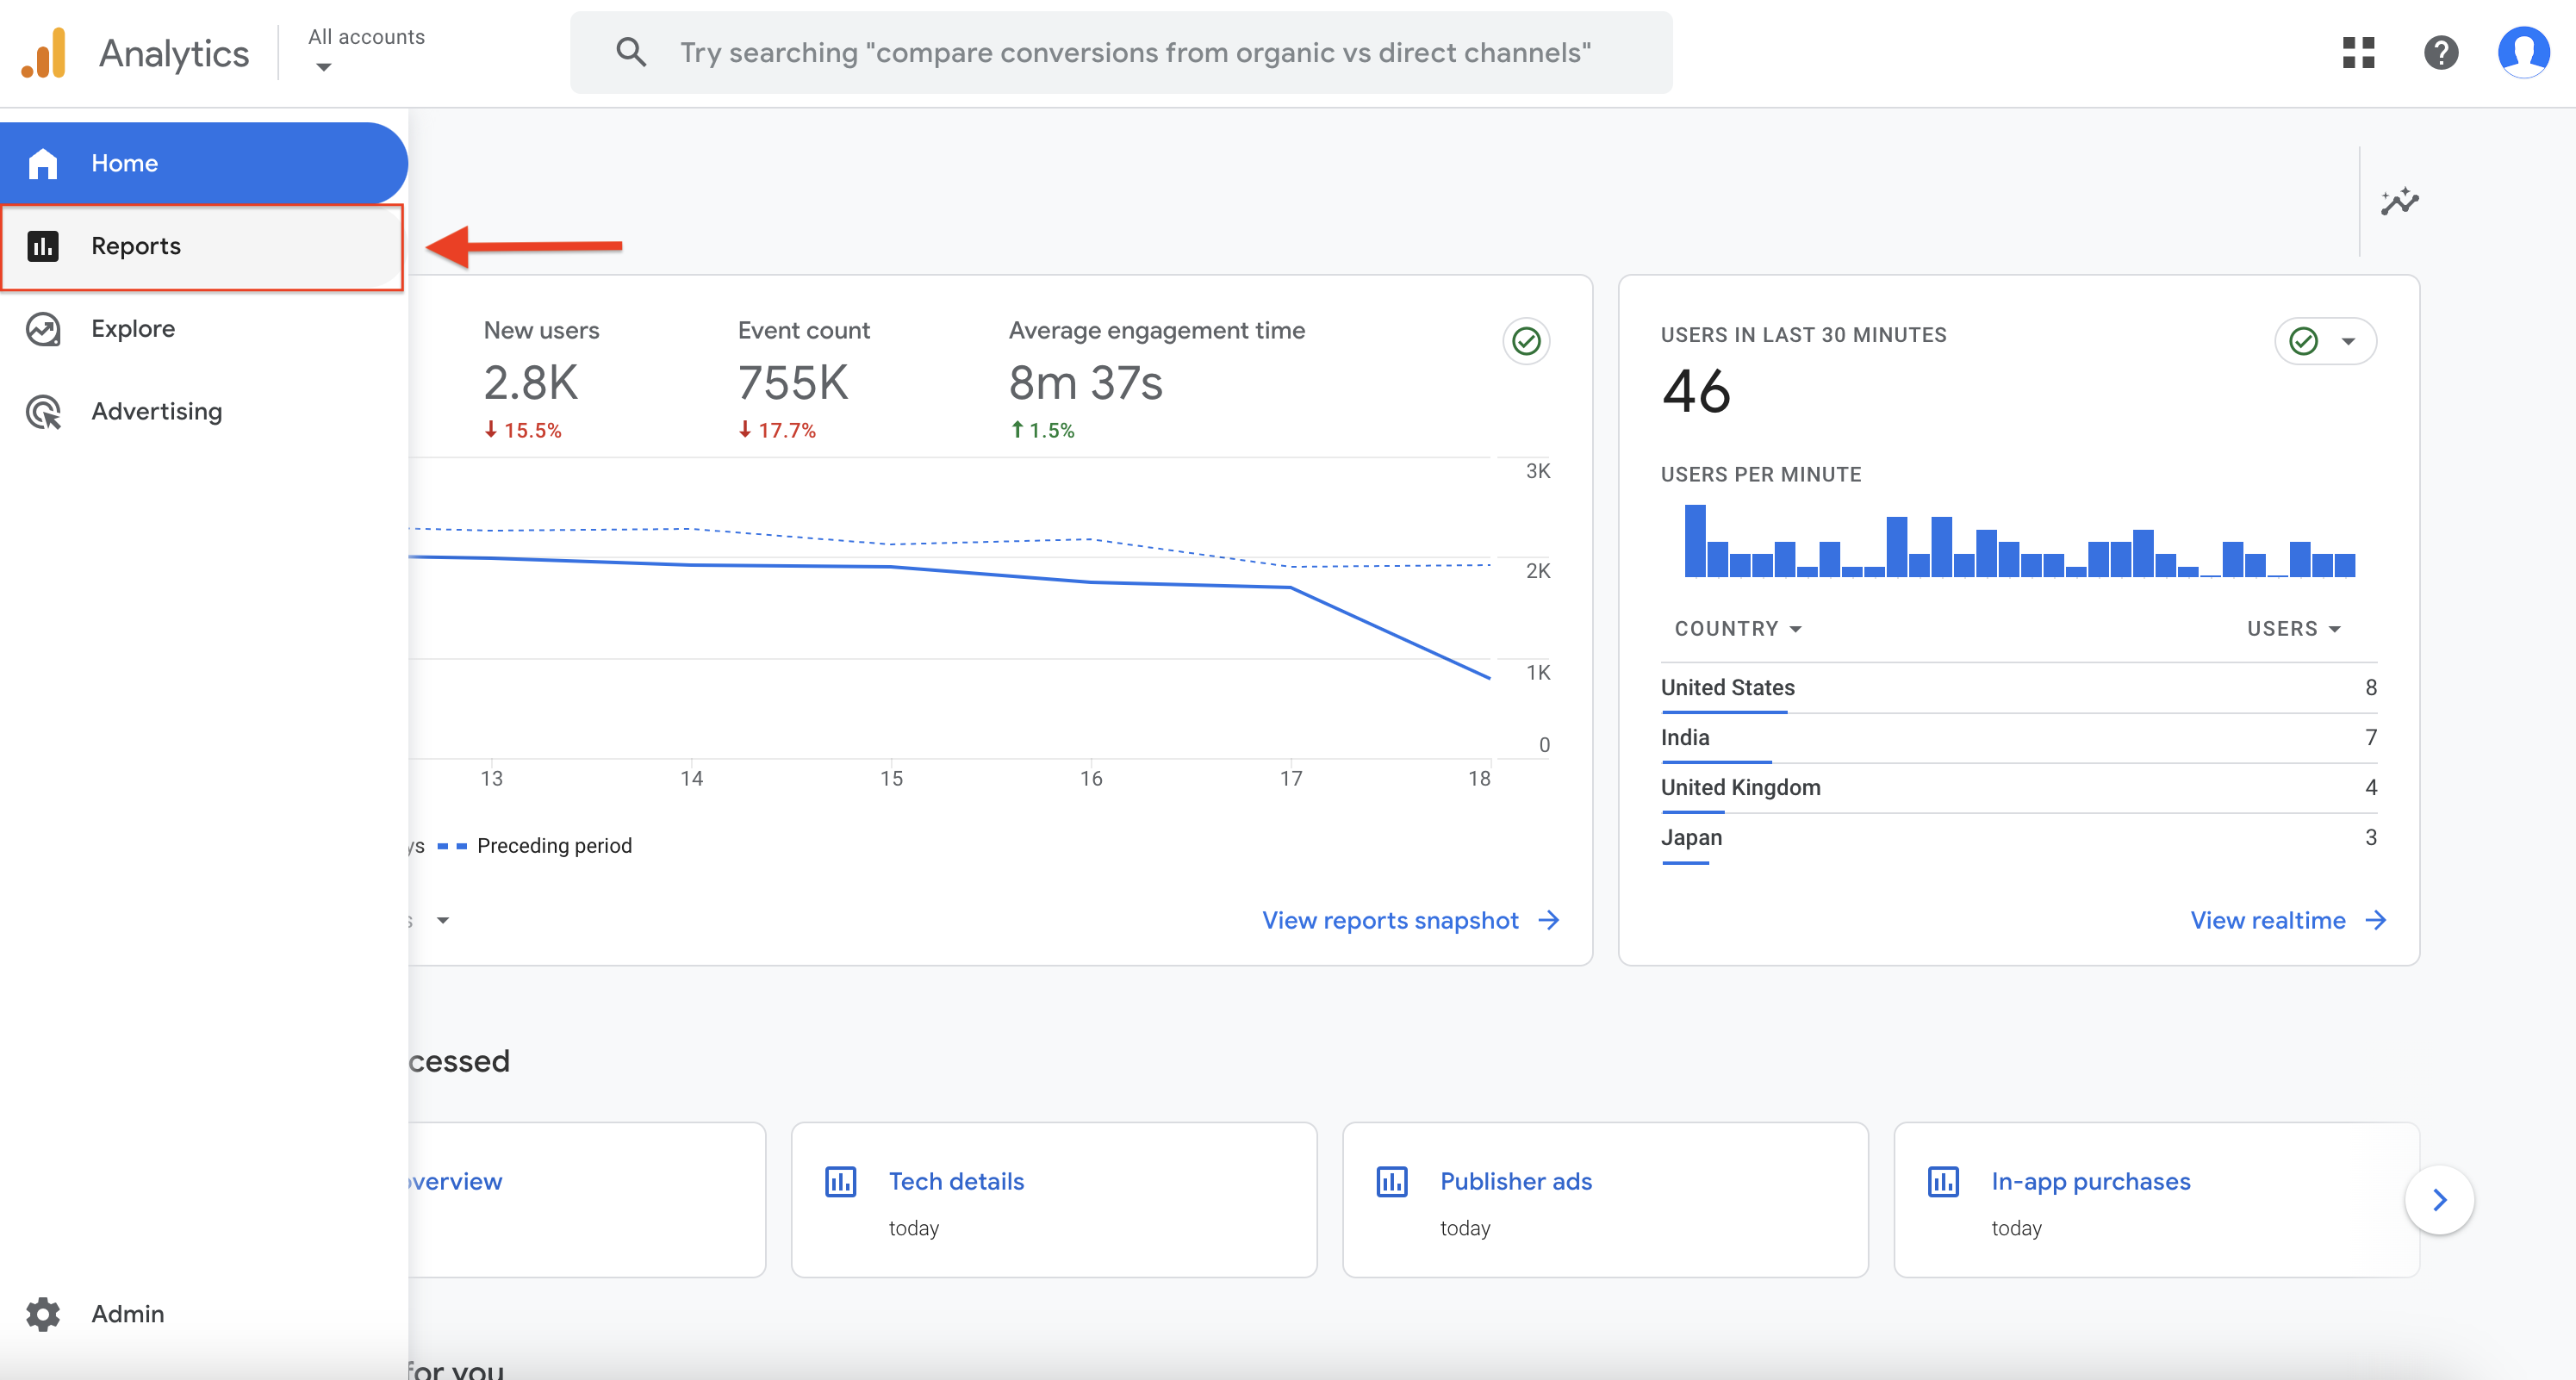
You access reports by clicking the Reports tab on the left menu.
What reports can you see in GA4?
User acquisition
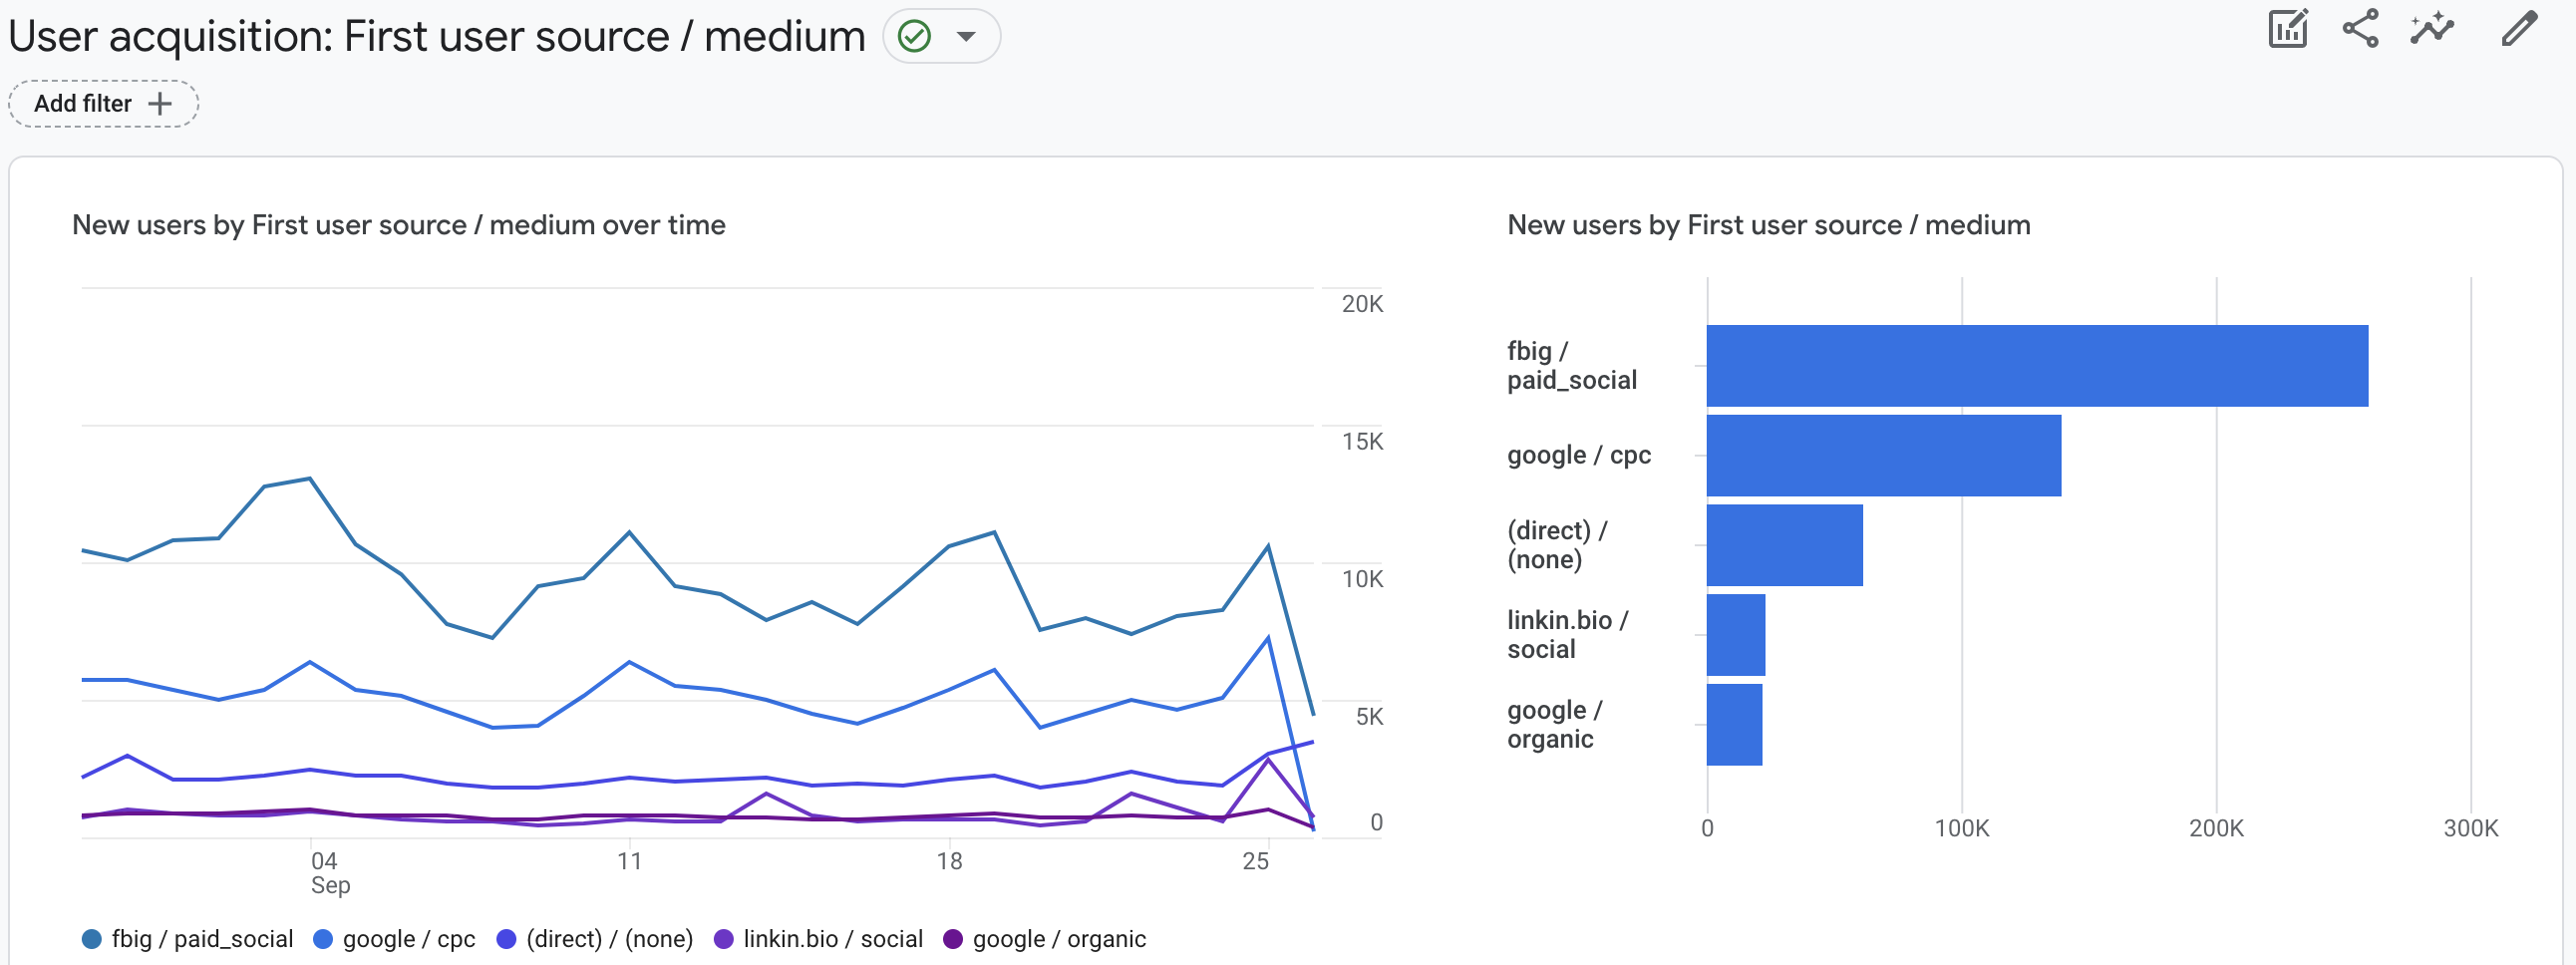
User acquisition allows you to see how users arrive at your website and how successful certain marketing campaigns are in attracting them.
Traffic acquisition
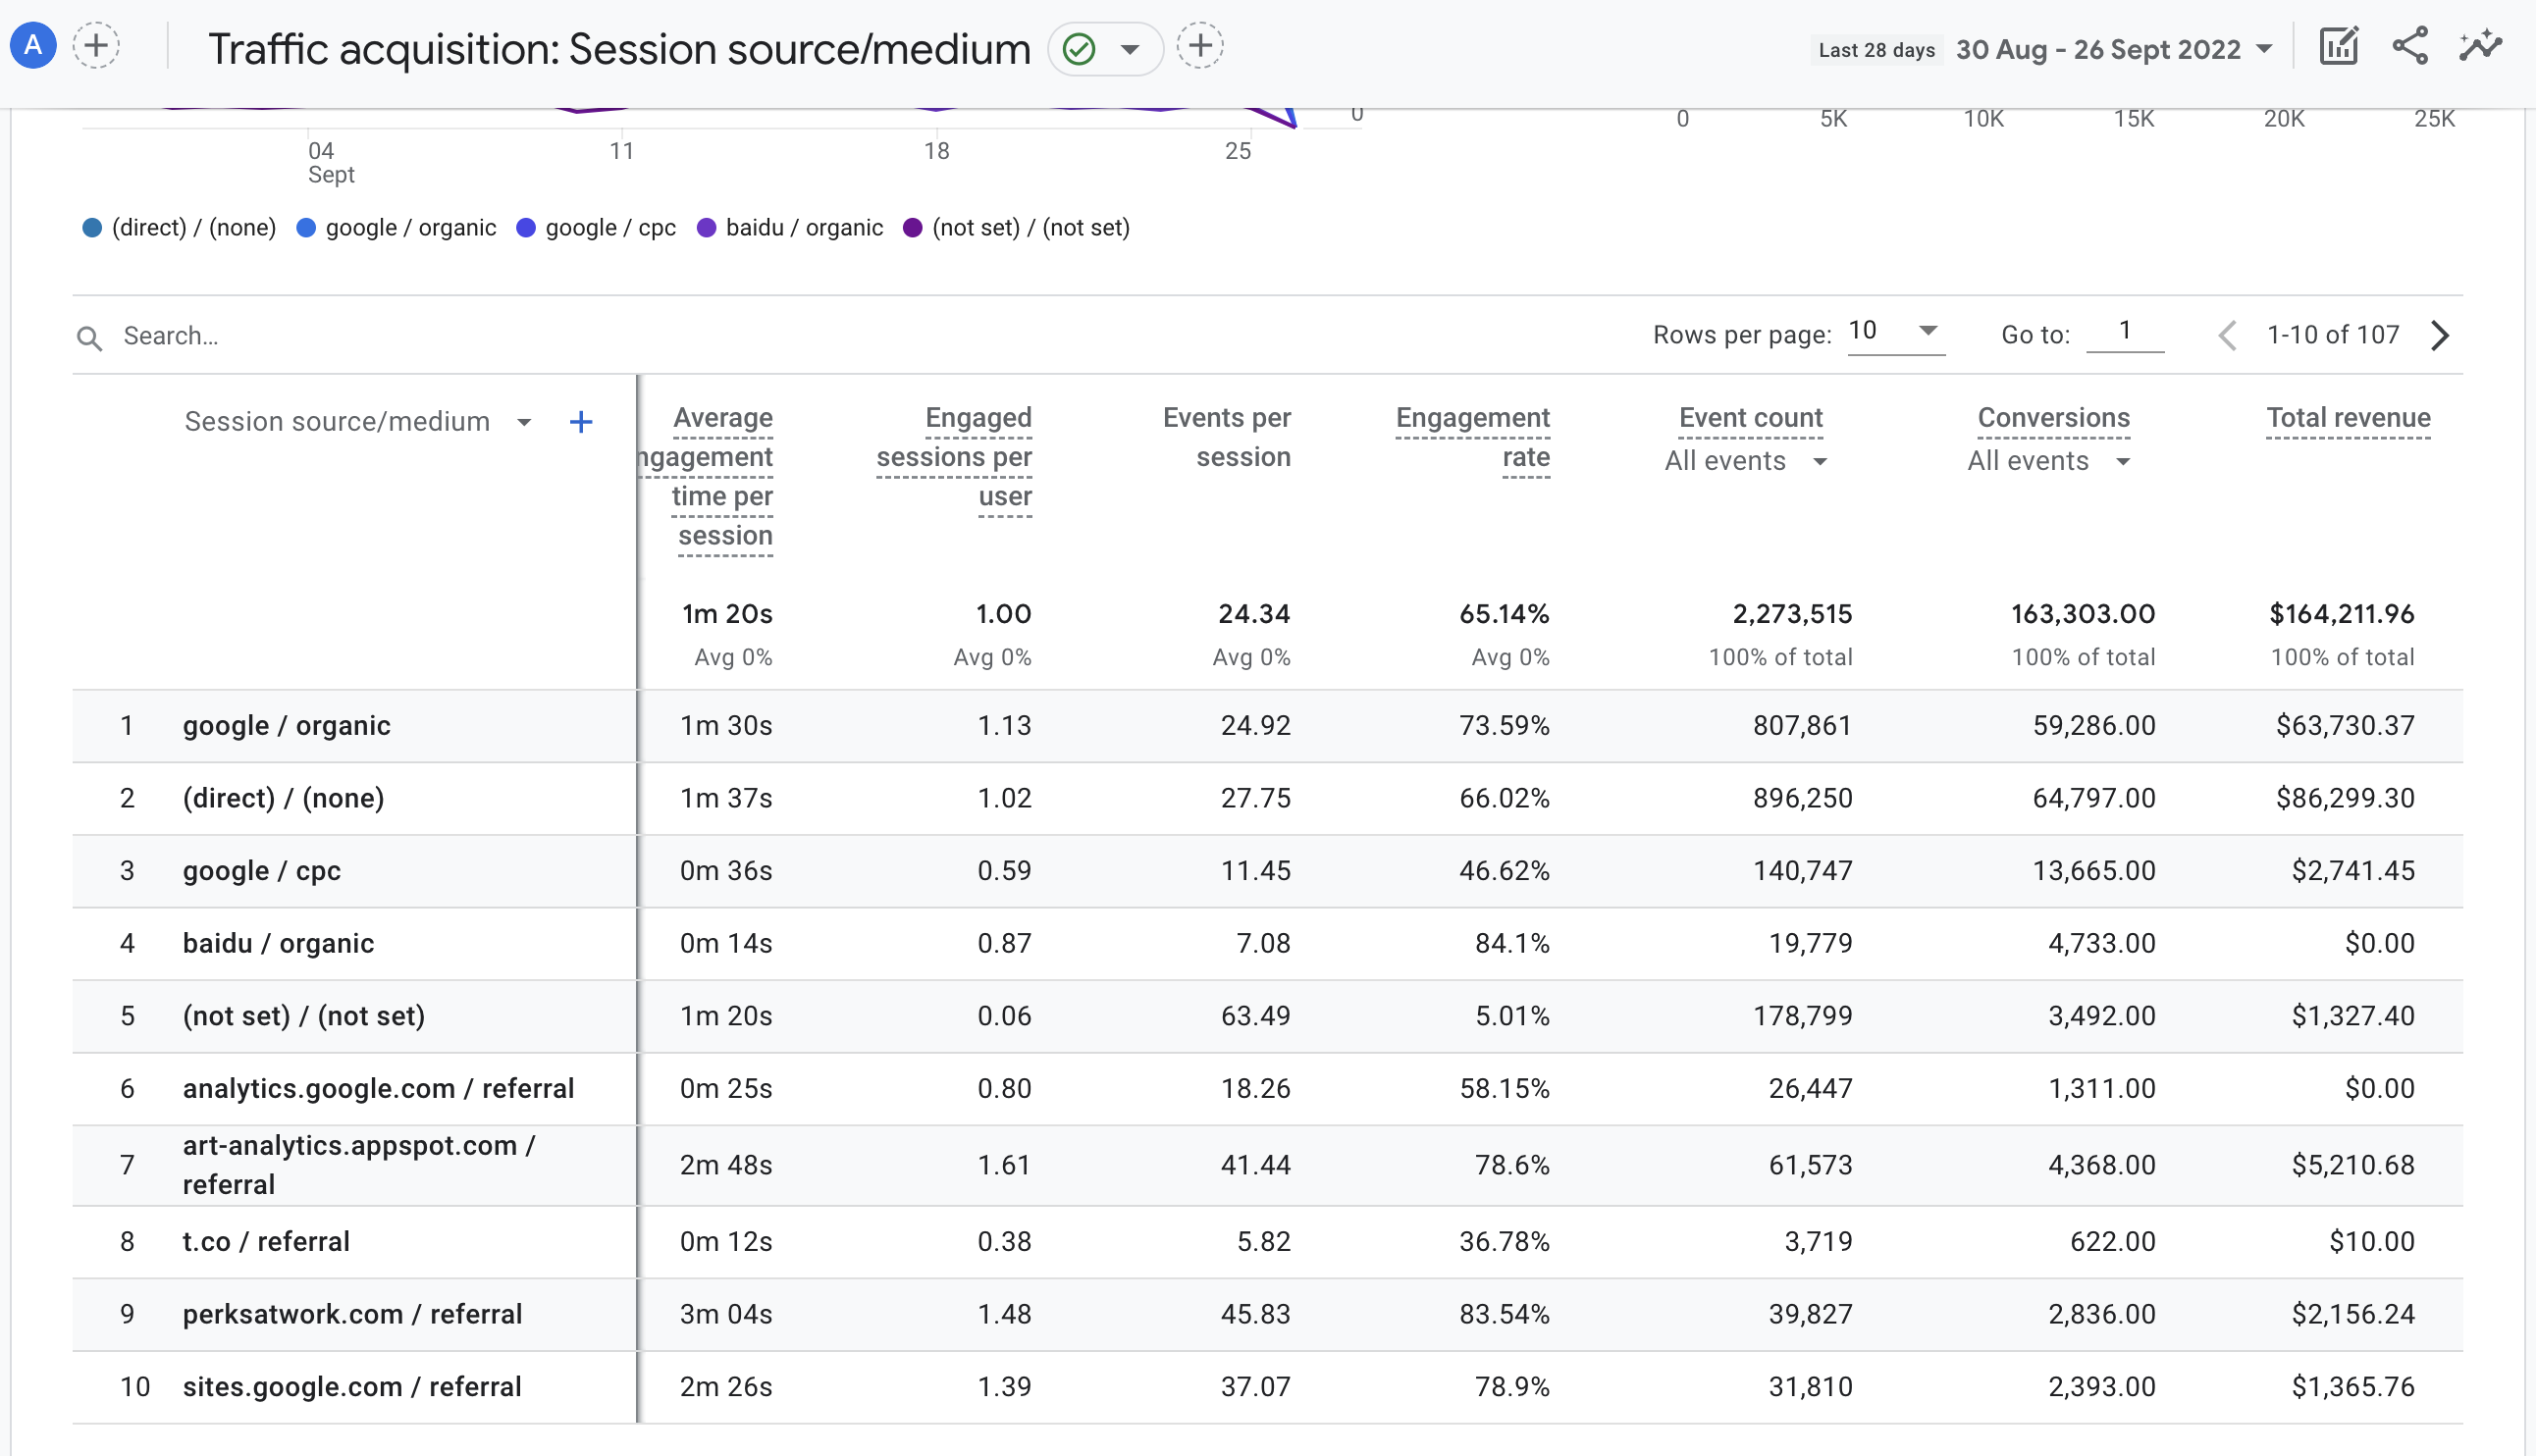
Traffic acquisition allows you to see how each session arrives at your website - as opposed to multi-session attribution in the previous report.
Monetisation overview
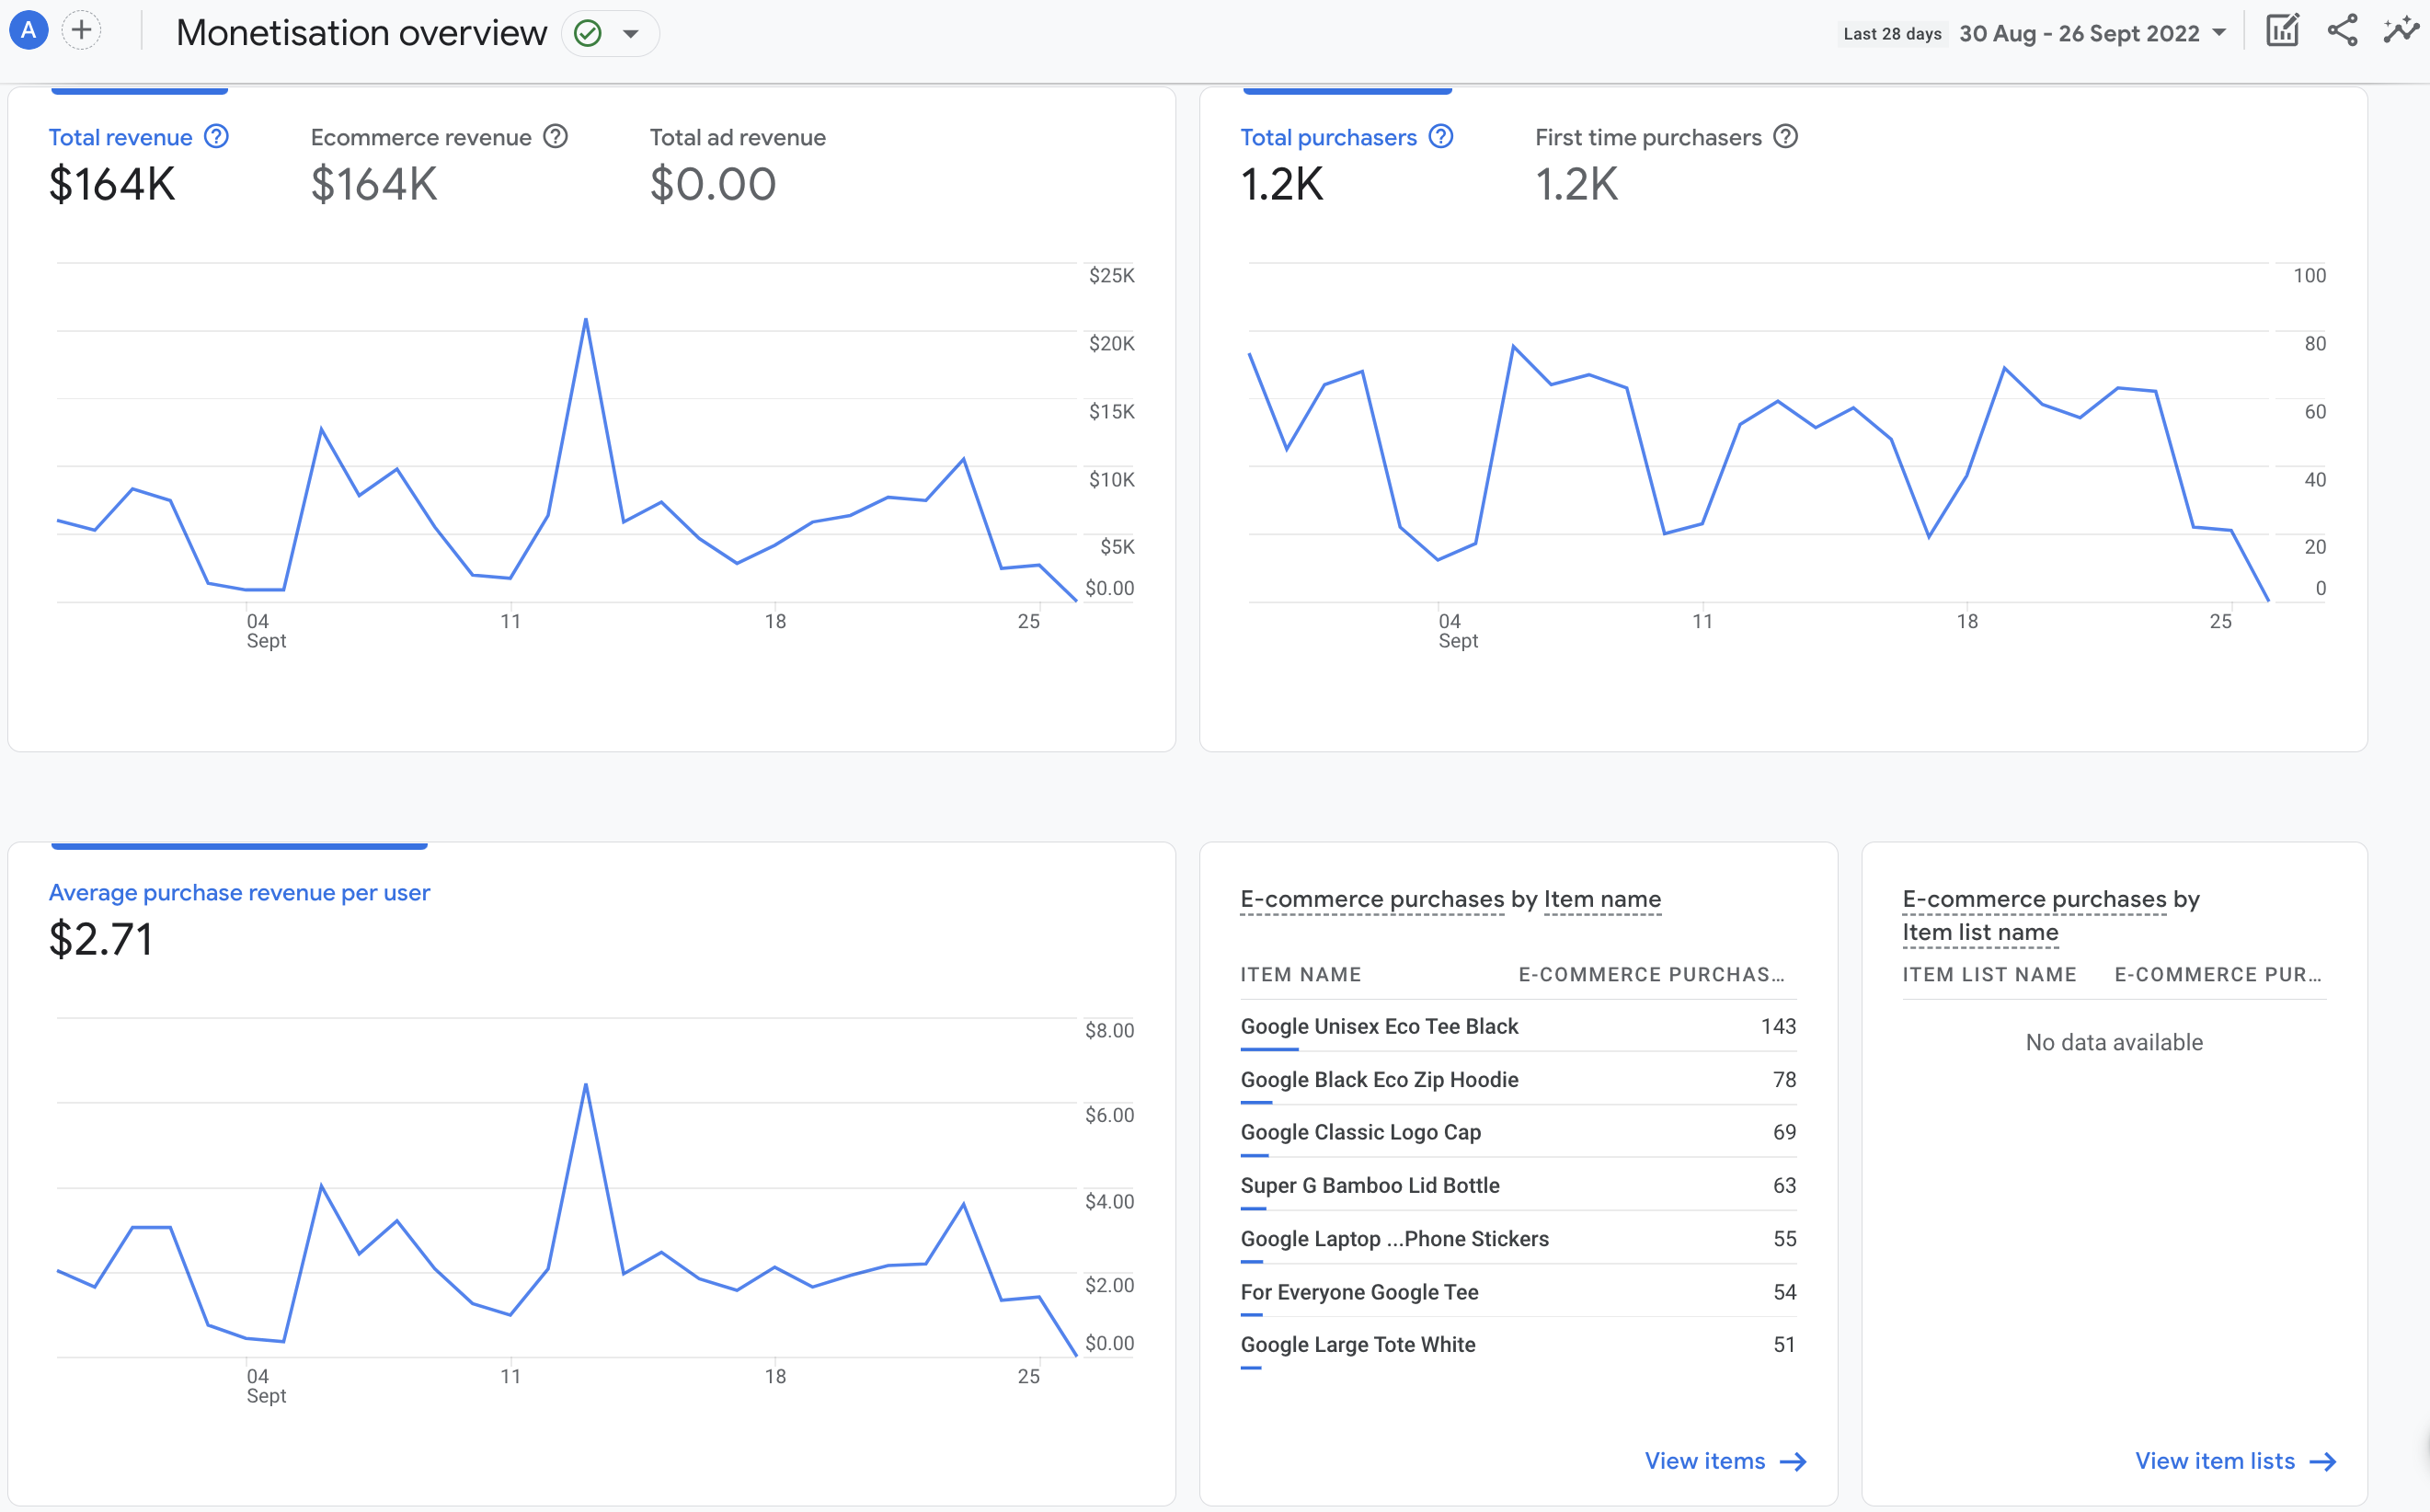
The Monetisation reports enable you to see the revenue you generate from the items, ads, and subscriptions on your website. You can also use the reports to see the number of your customers who view each item you sell and other data about the things that generate revenue for your business.
Conversions
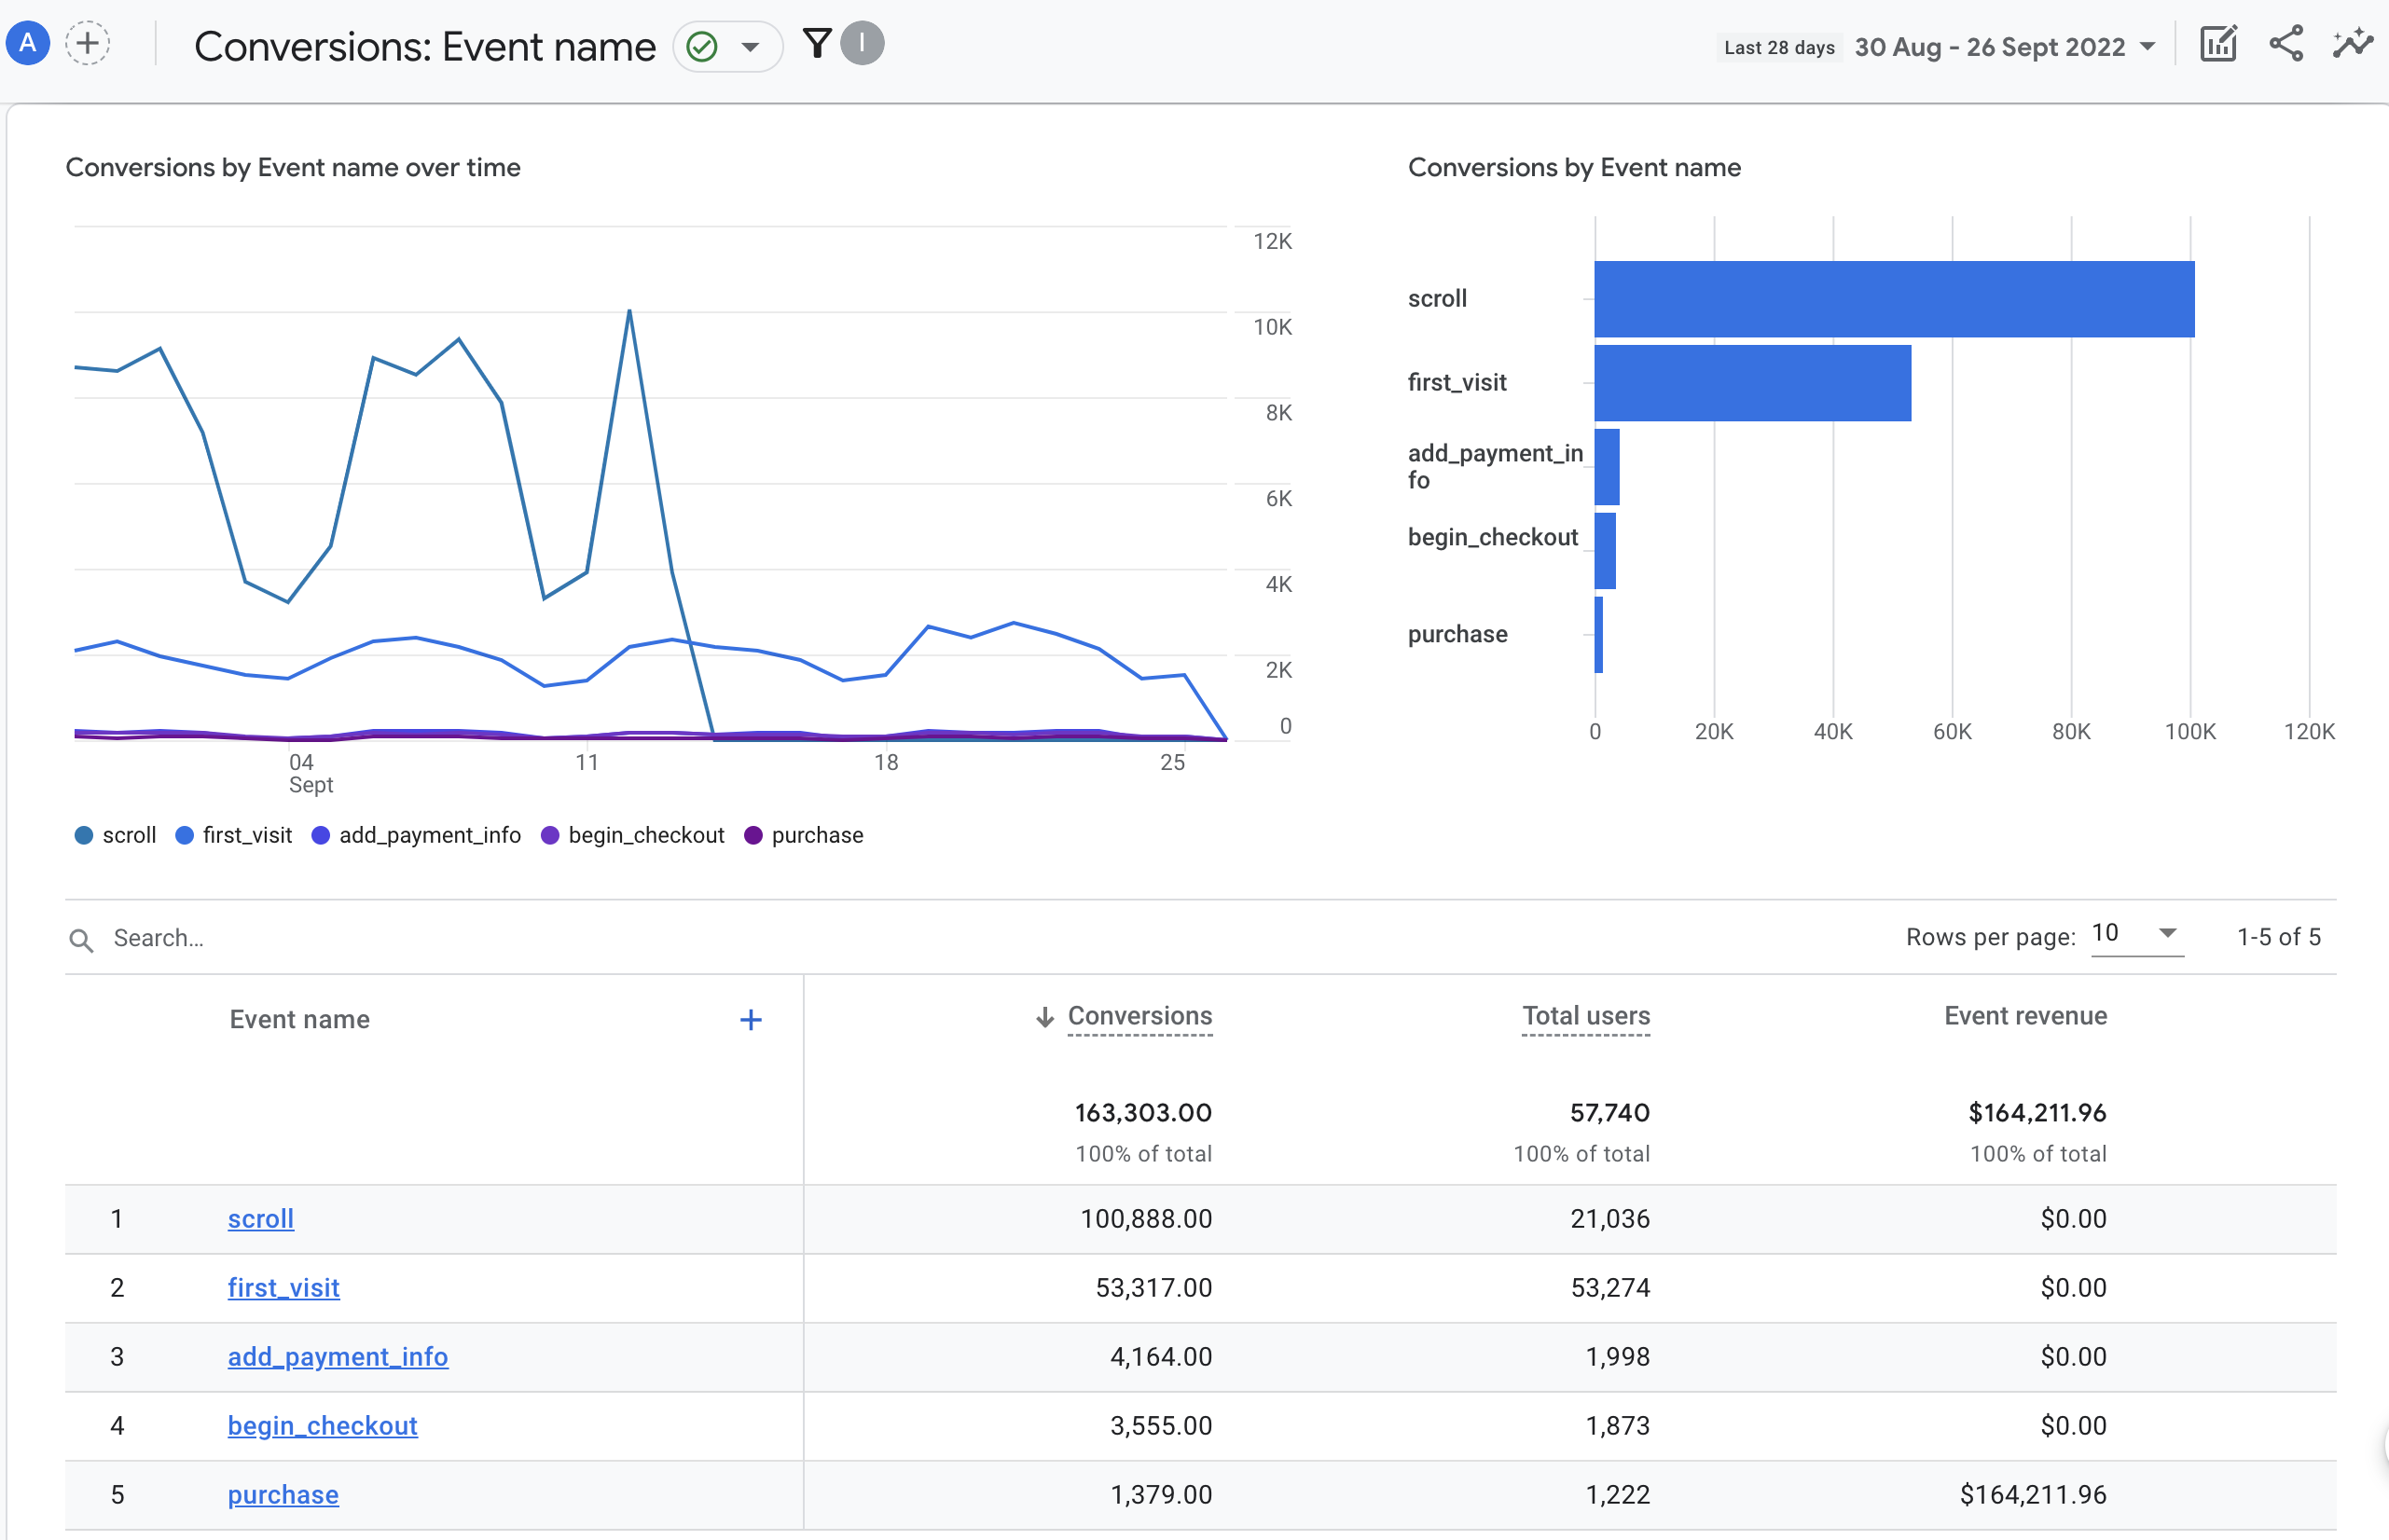
Conversions shows you a summary of all purchases, alongside any non-purchase events that you mark as conversions.
Ecommerce purchases
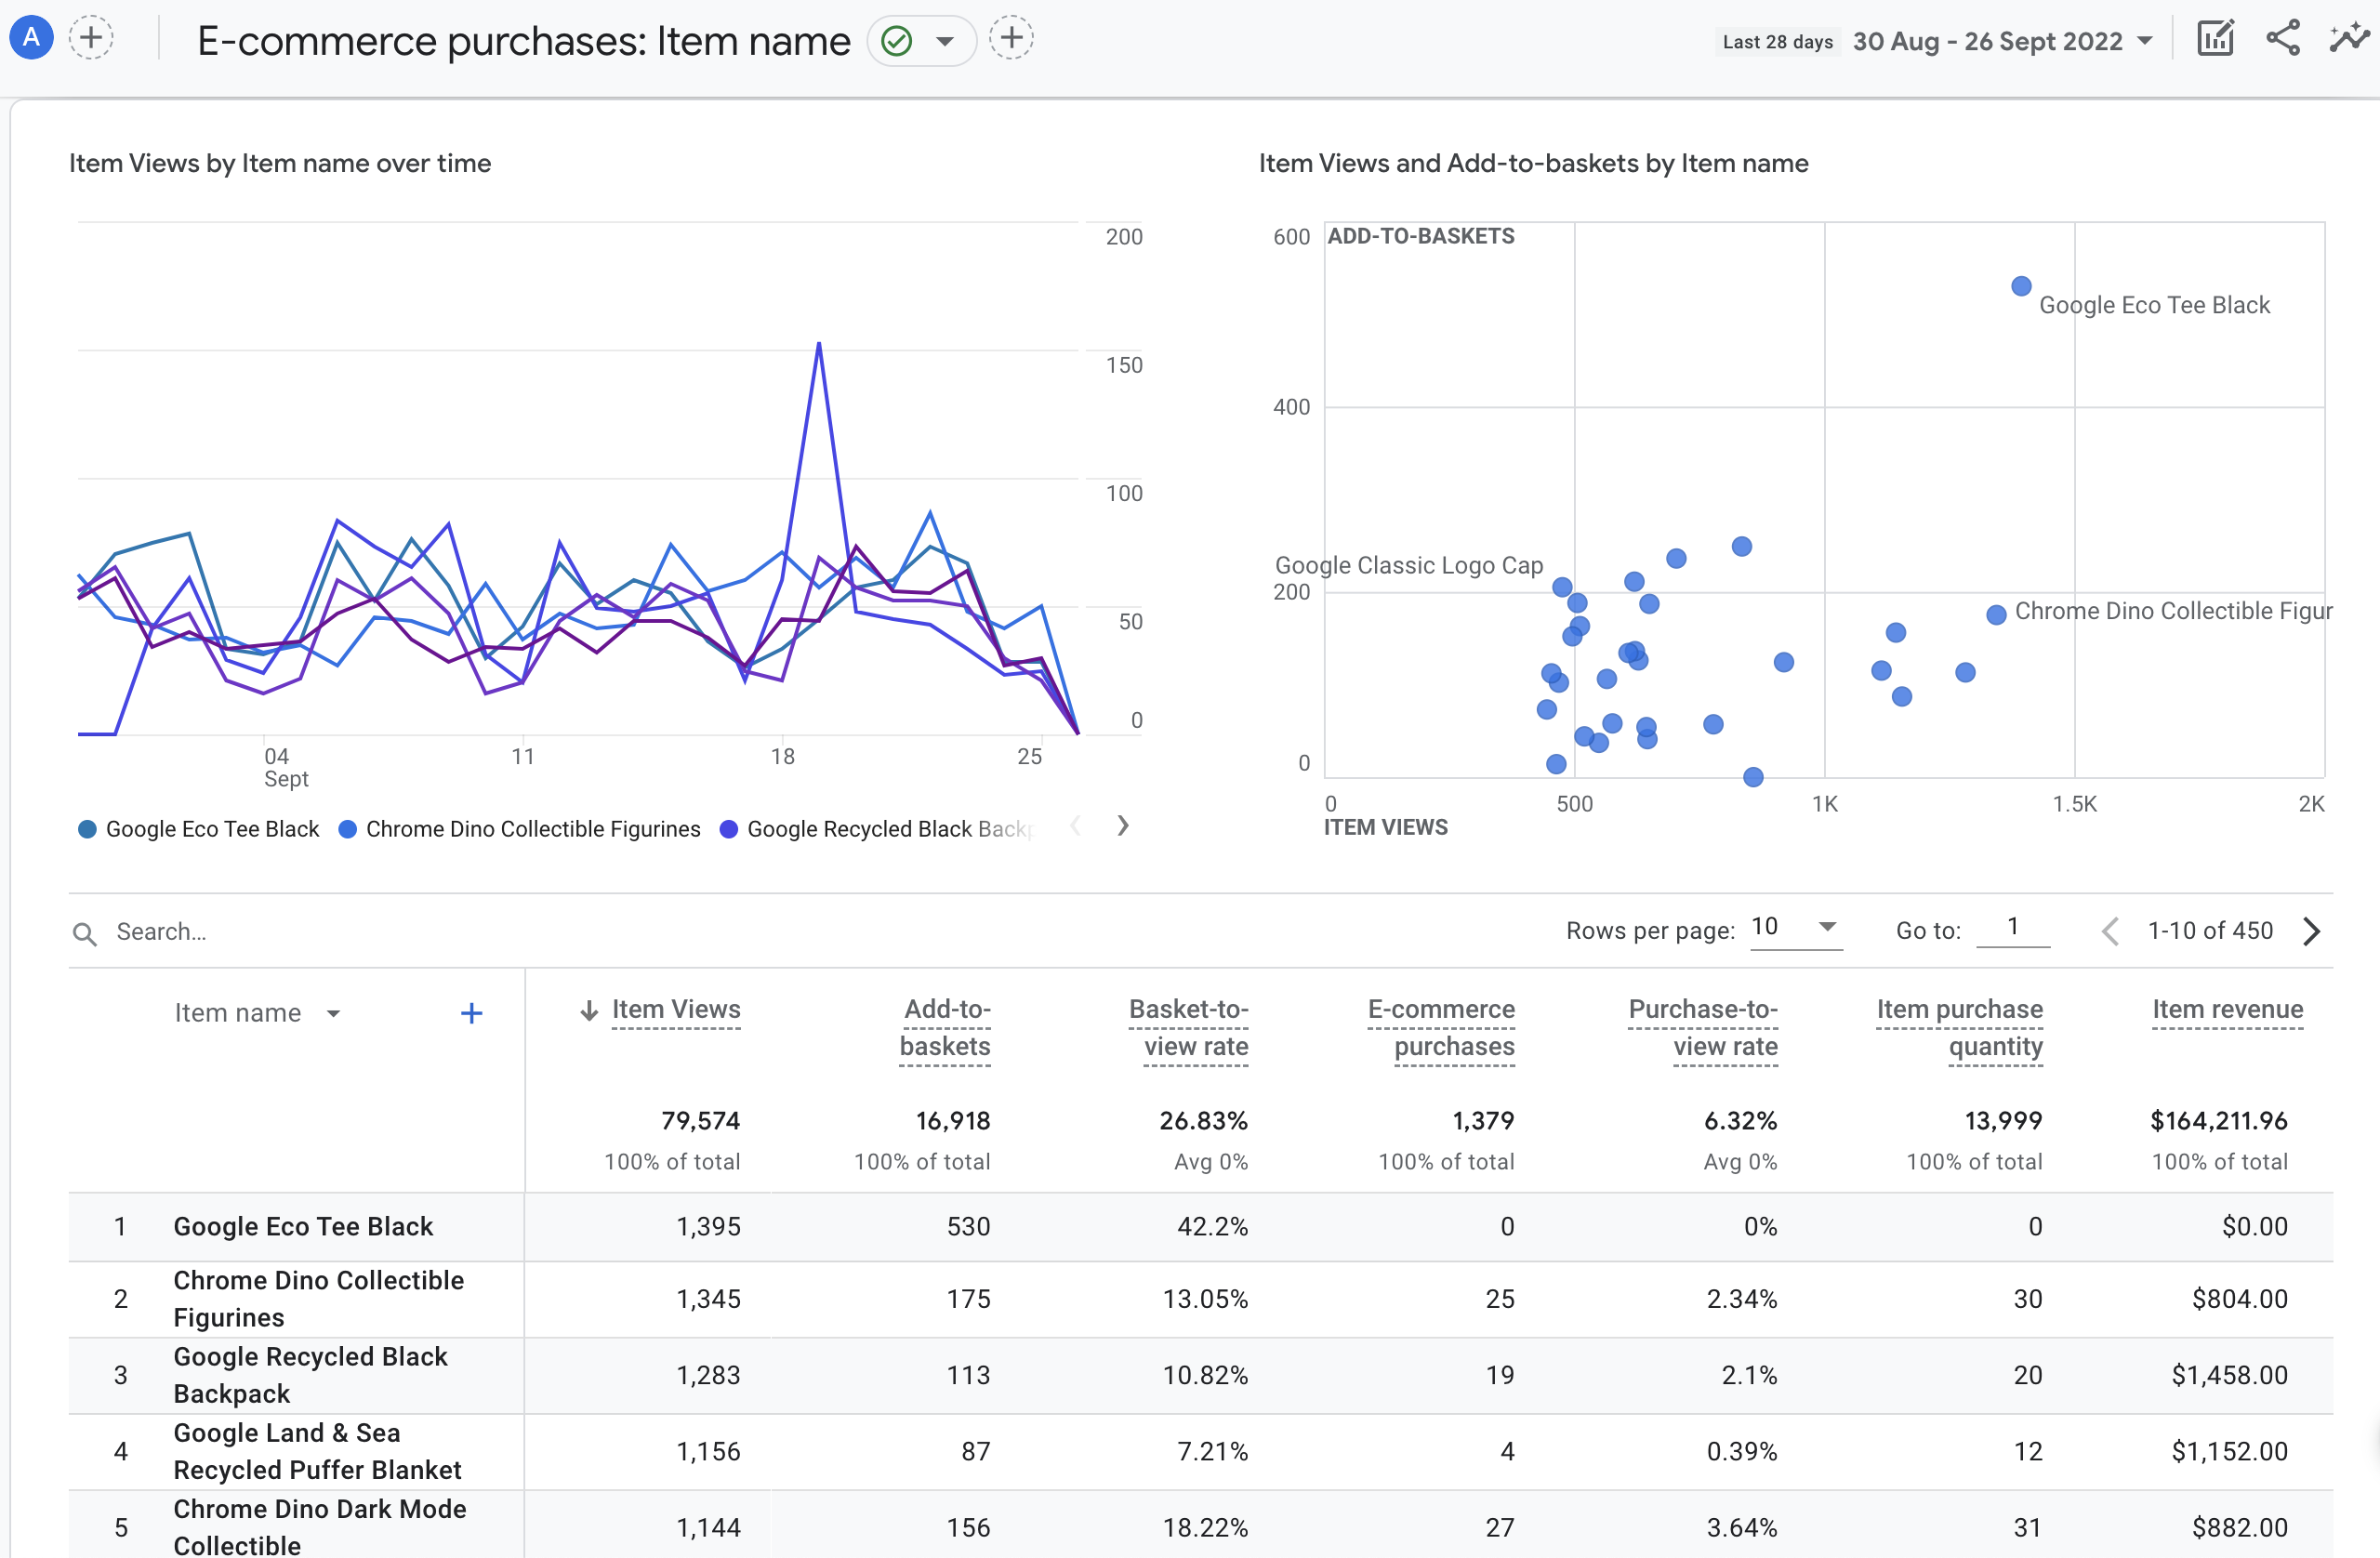
Ecommerce purchases offer details about each product you’re selling. This is useful when analysing which products are performing well so you can further optimize your offering.
Engagement overview
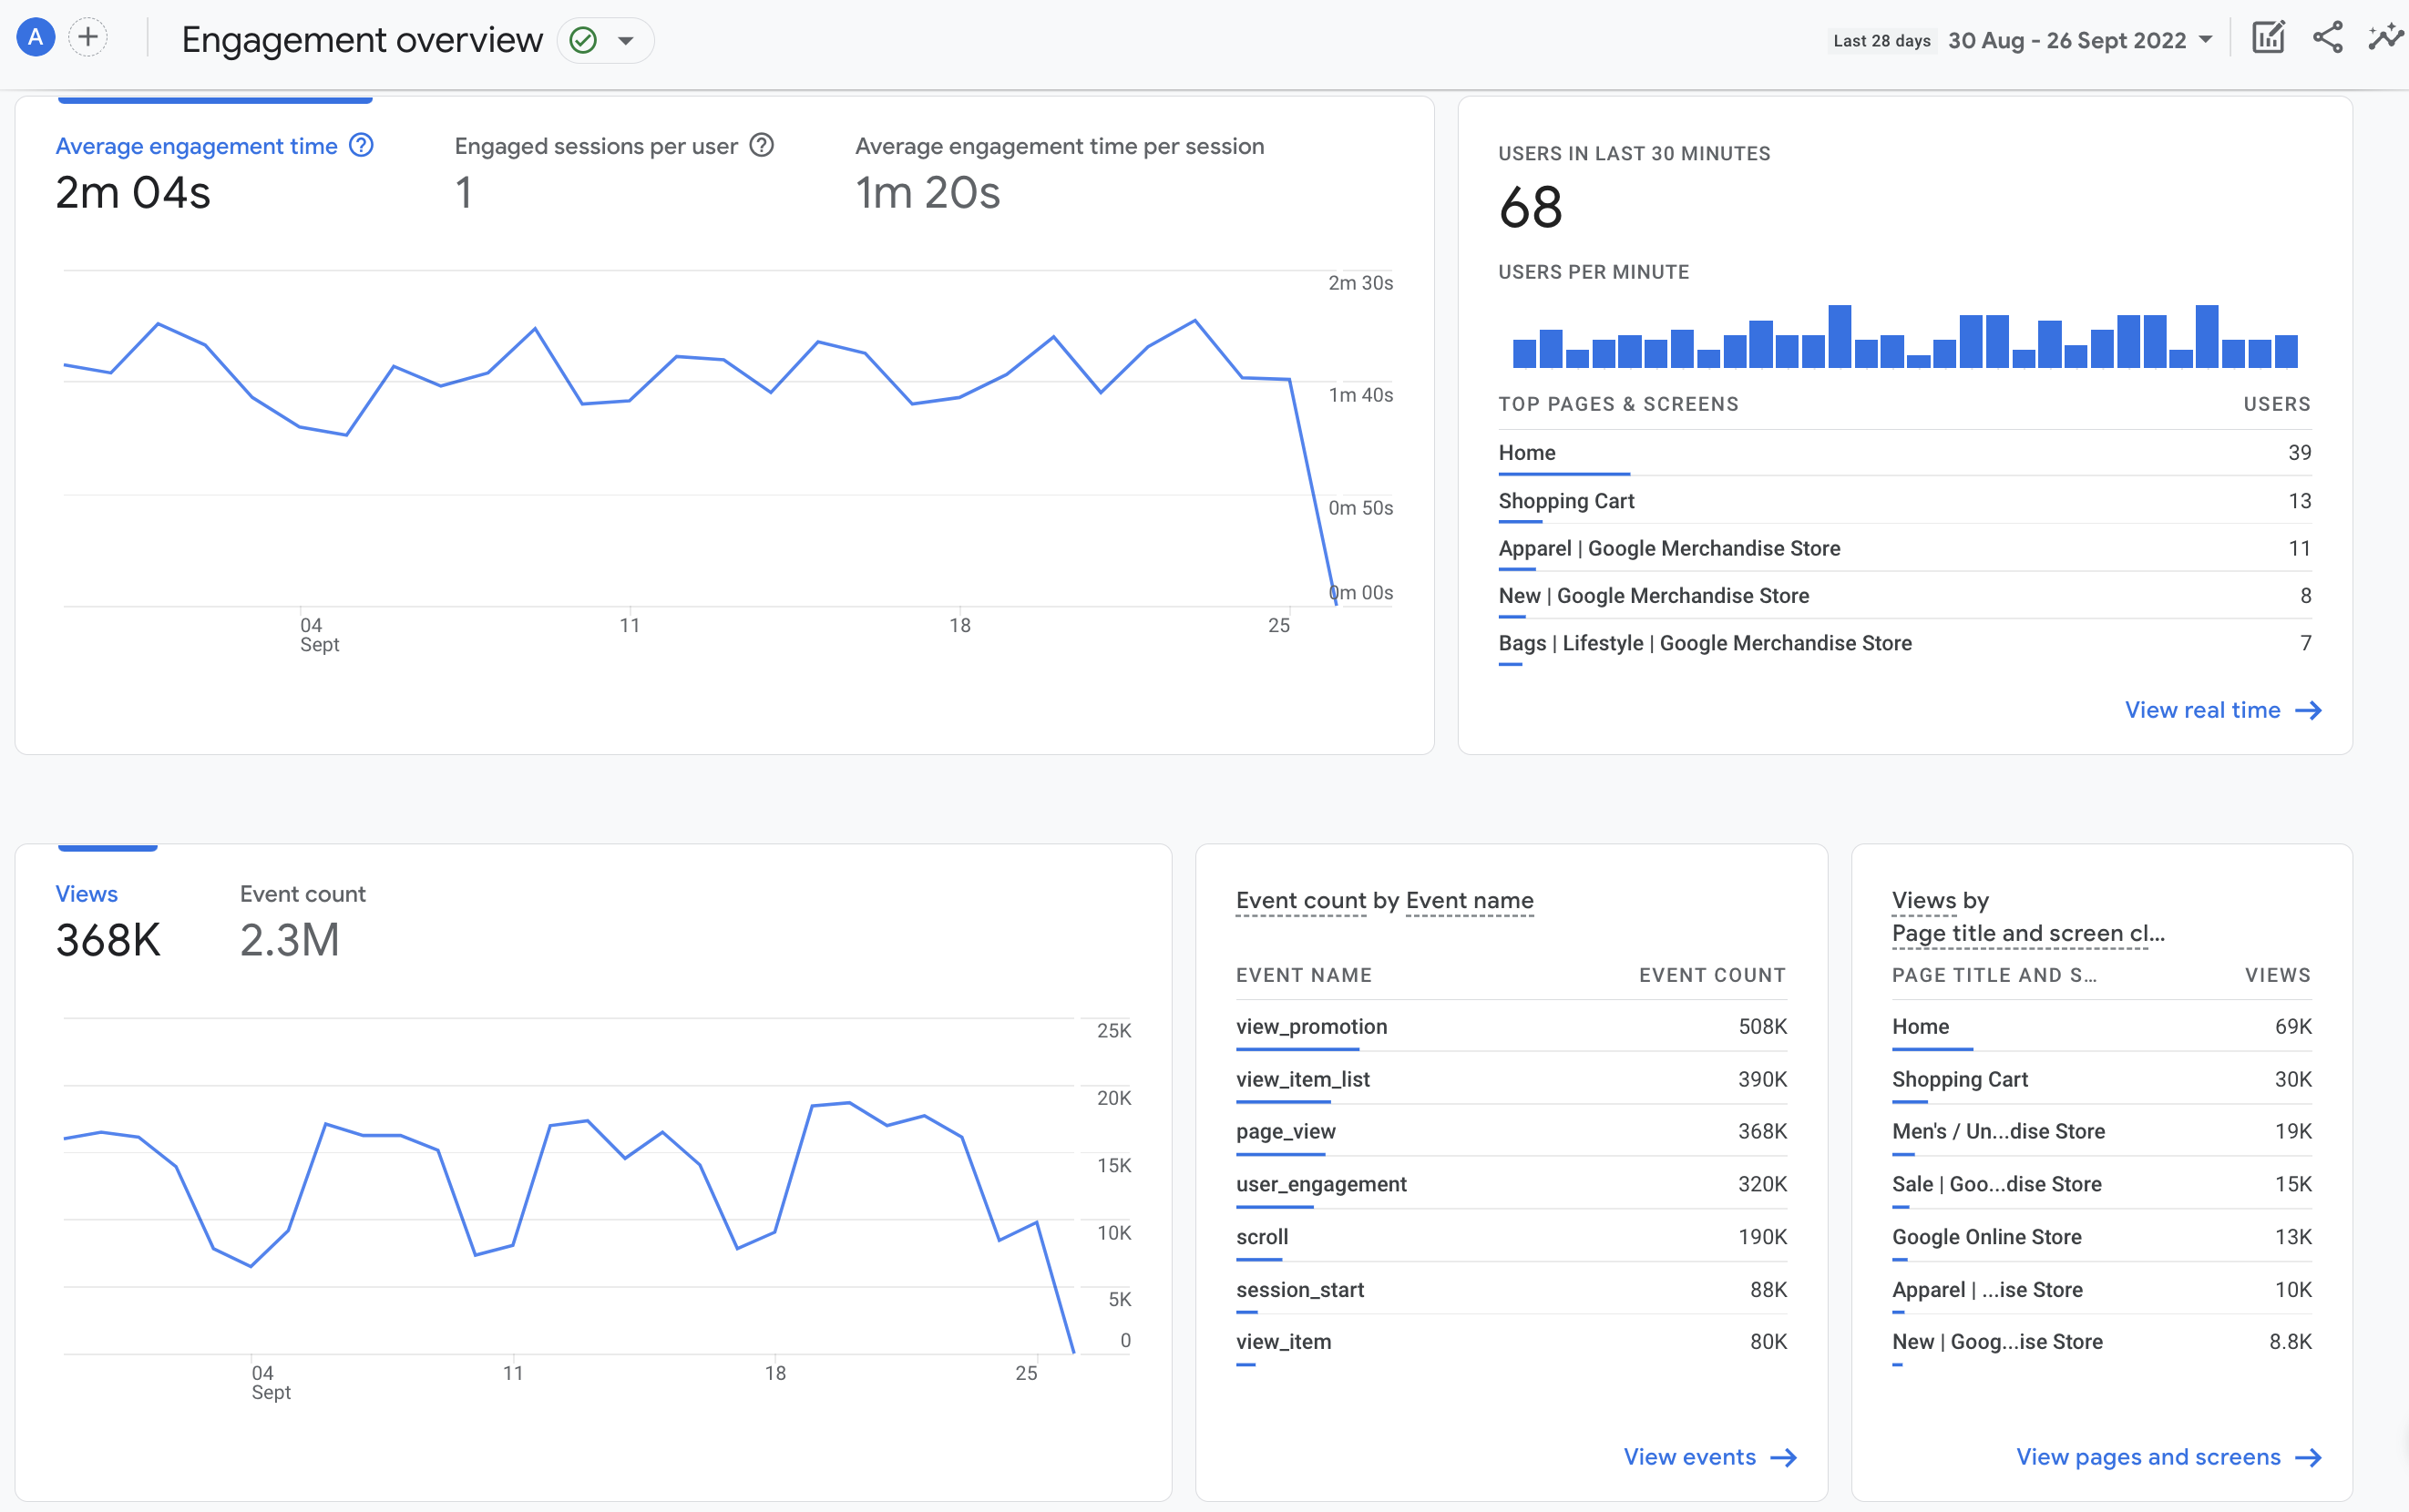
Engagement overview can help you analyse customer’s actions, which can help with retargeting customers more effectively and turning visitors into paying customers.
Events
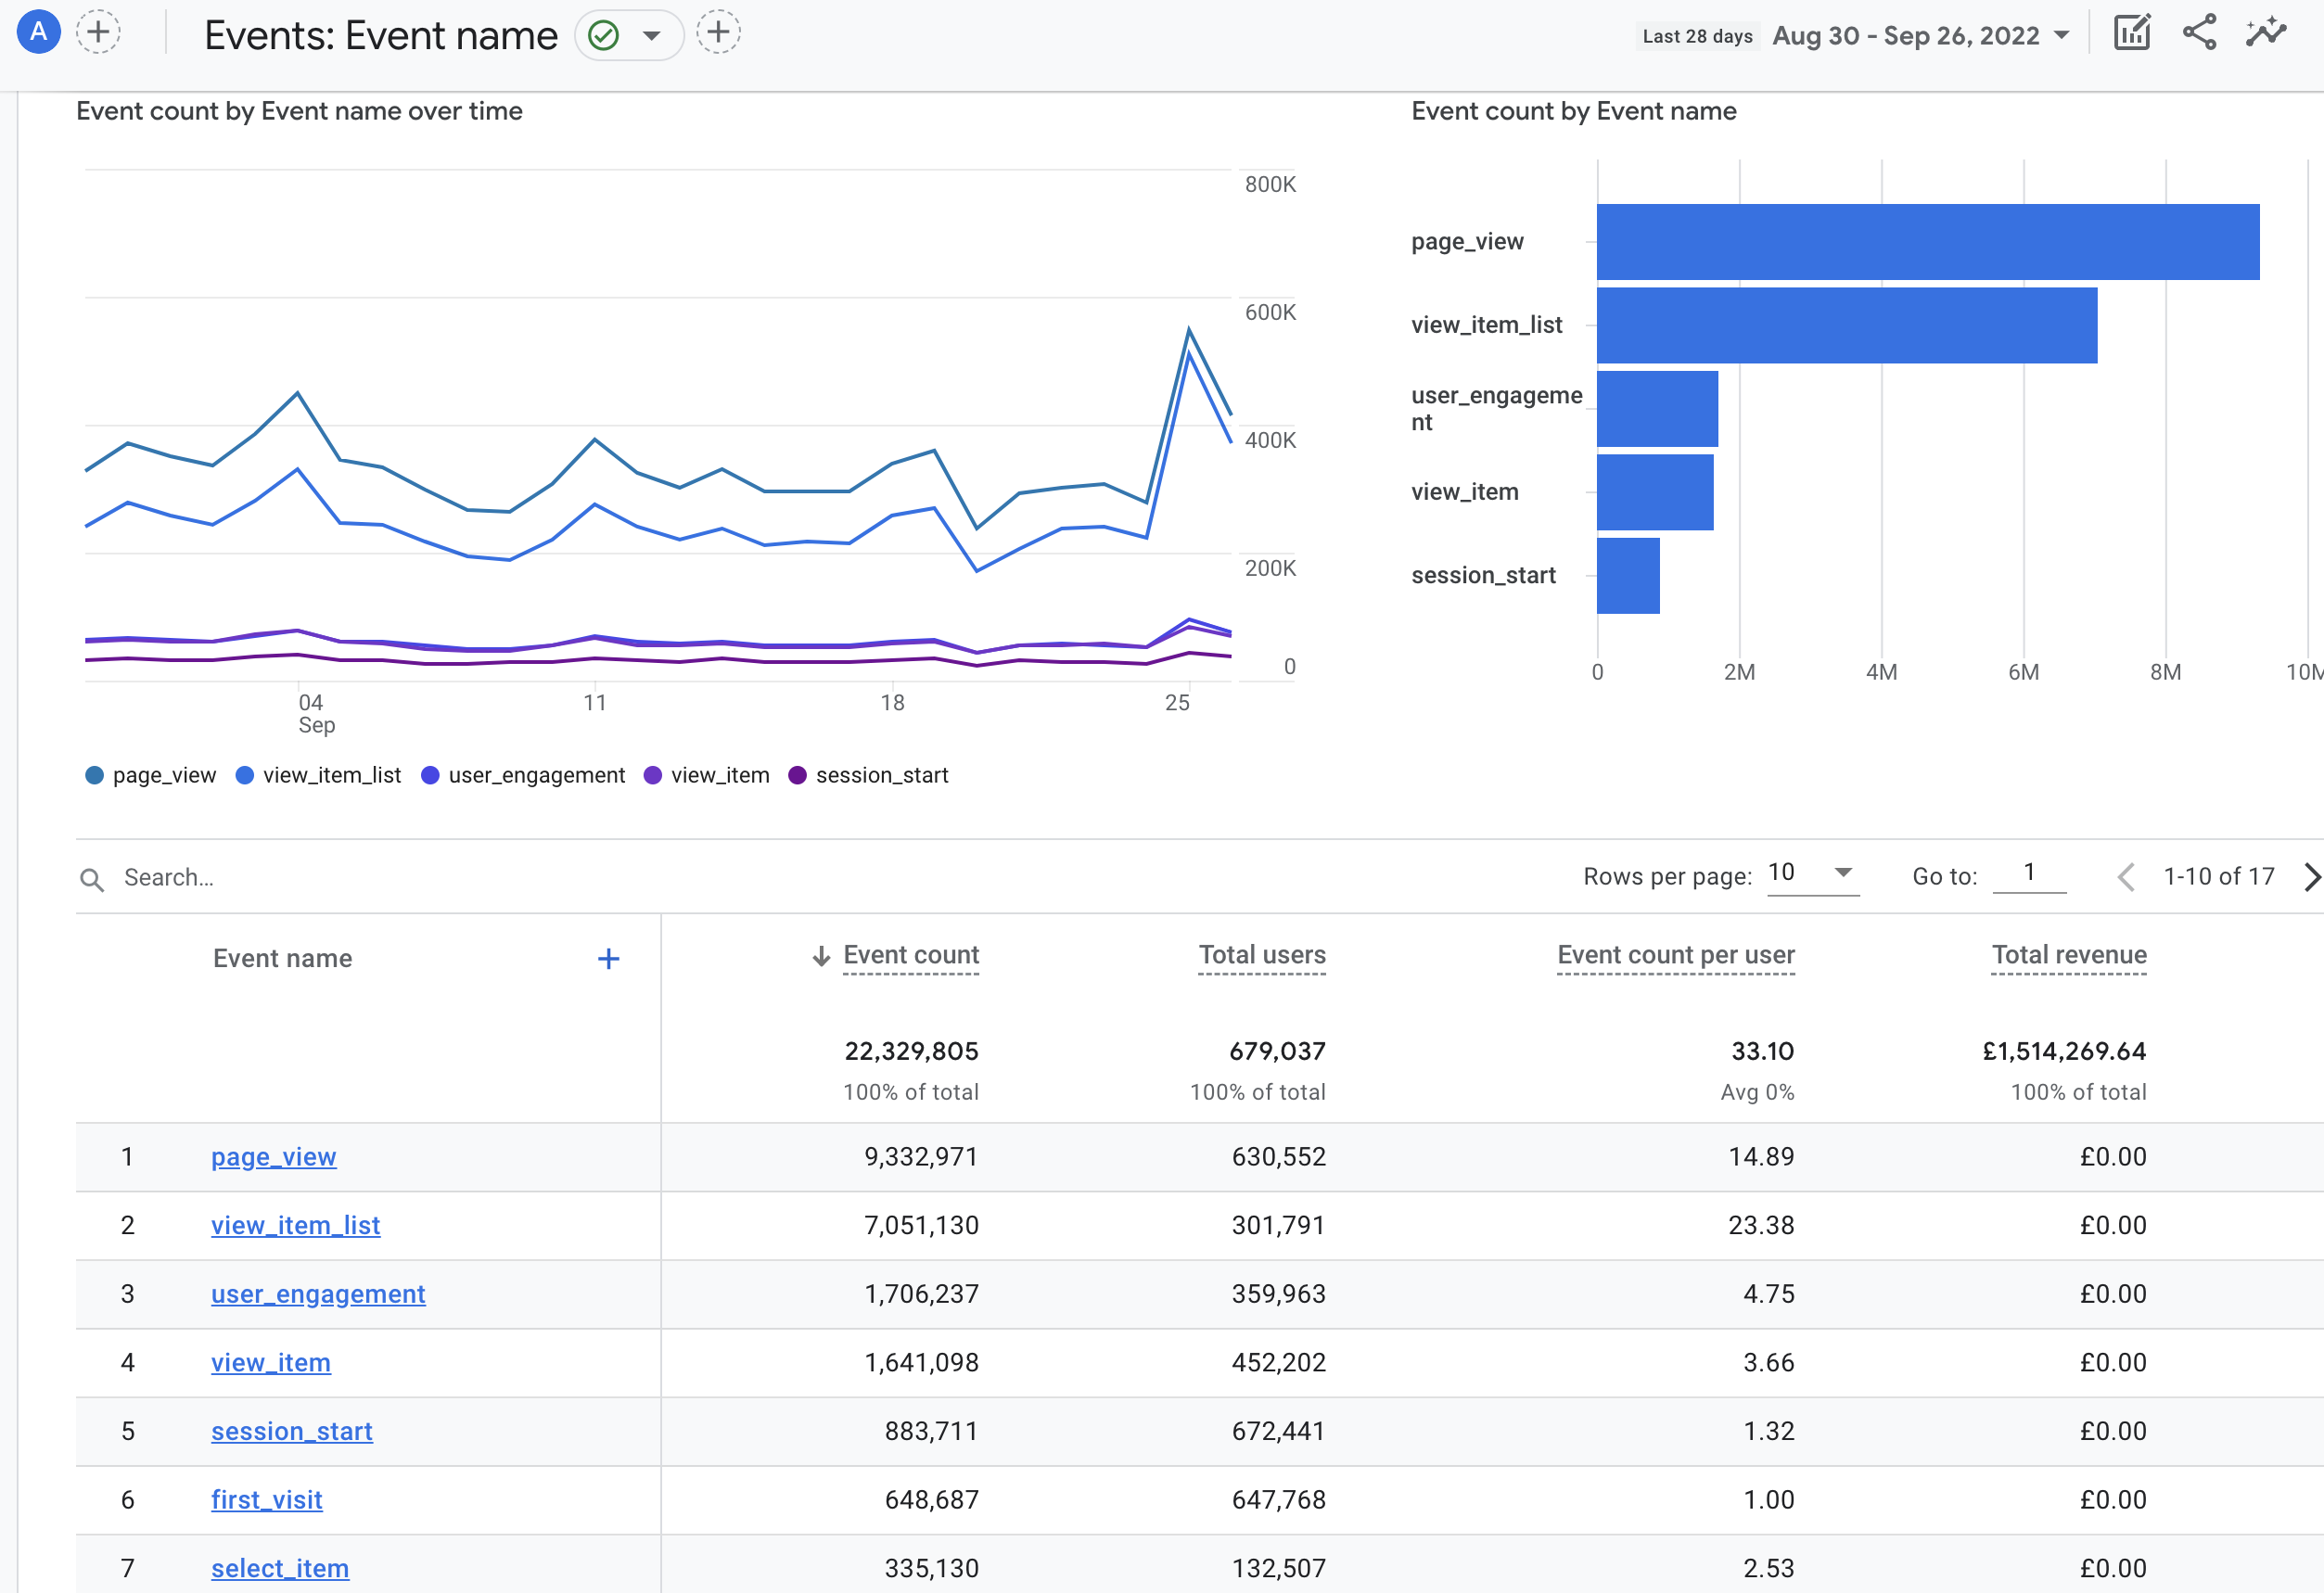
Using Event Tracking to measure interaction on your website offers a better understanding of how users are engaging with features of your website in a more advanced way than the standard reports do. Littledata sends over 13 types of event.
Demographics

Demographics may help you refine your marketing strategy so you can drive more traffic from demographics that are more likely to convert.
Retention
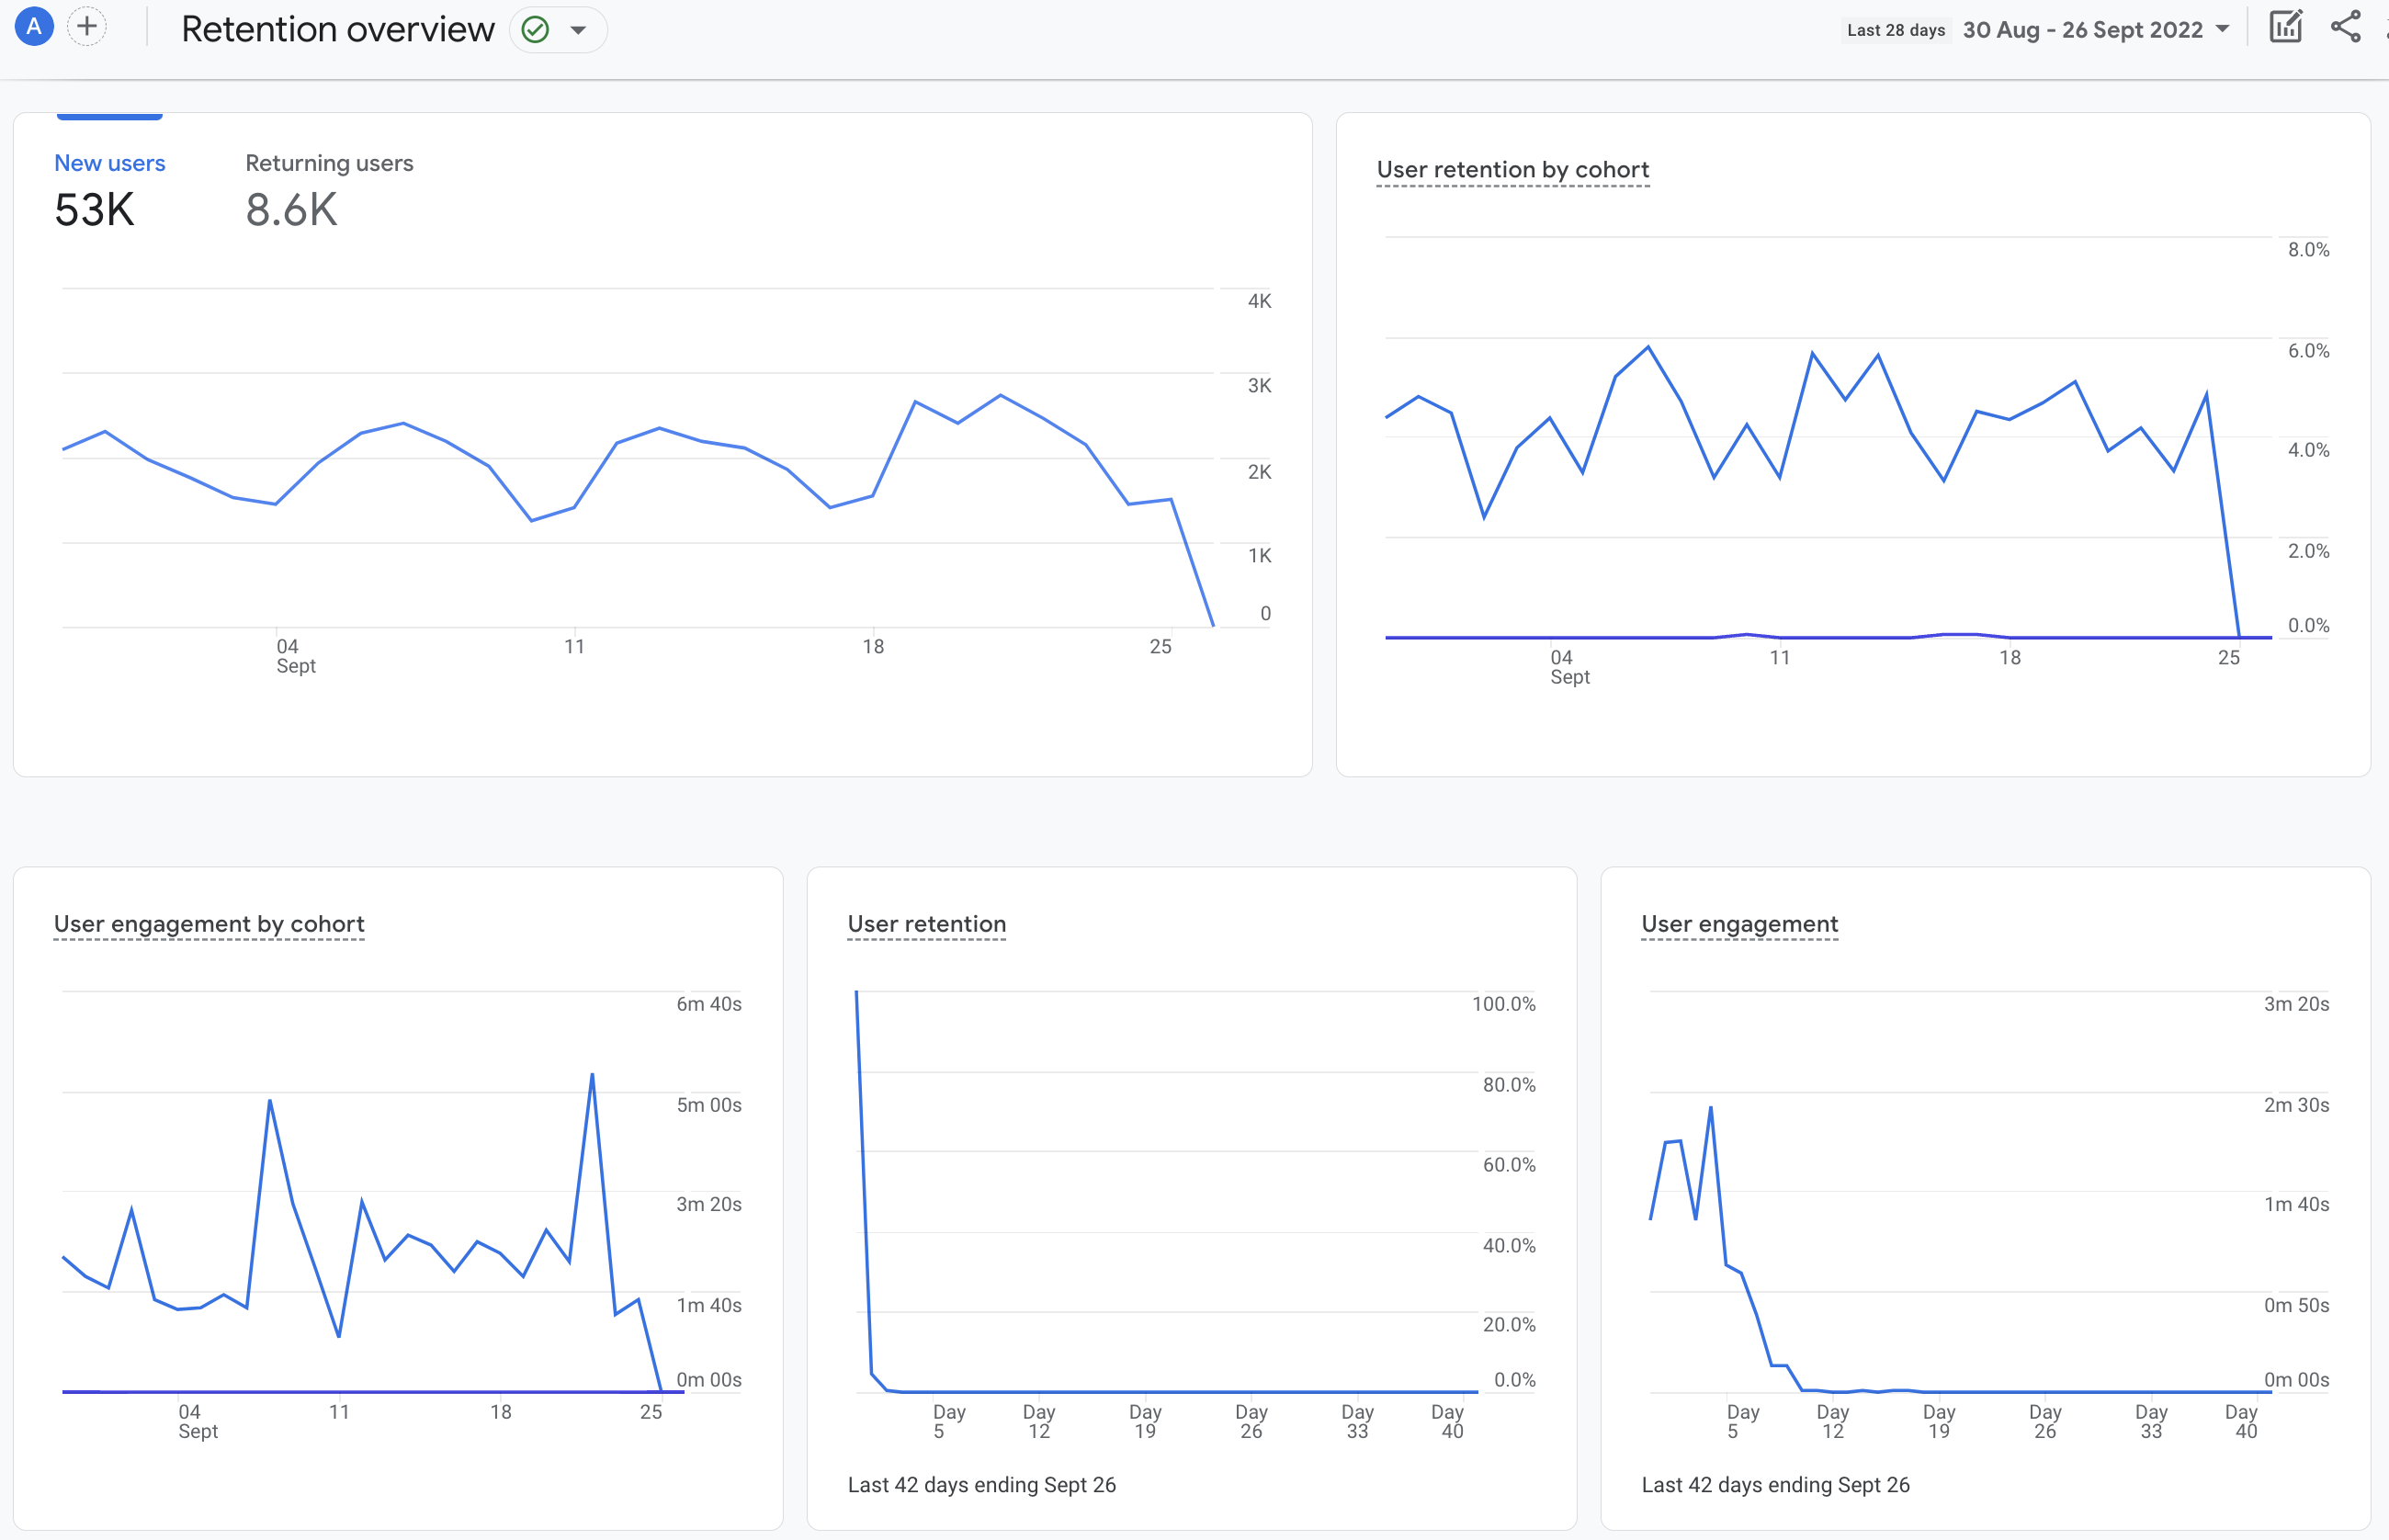
The Retention report helps you understand how frequently and for how long users engage with your website after their first visit.
Realtime
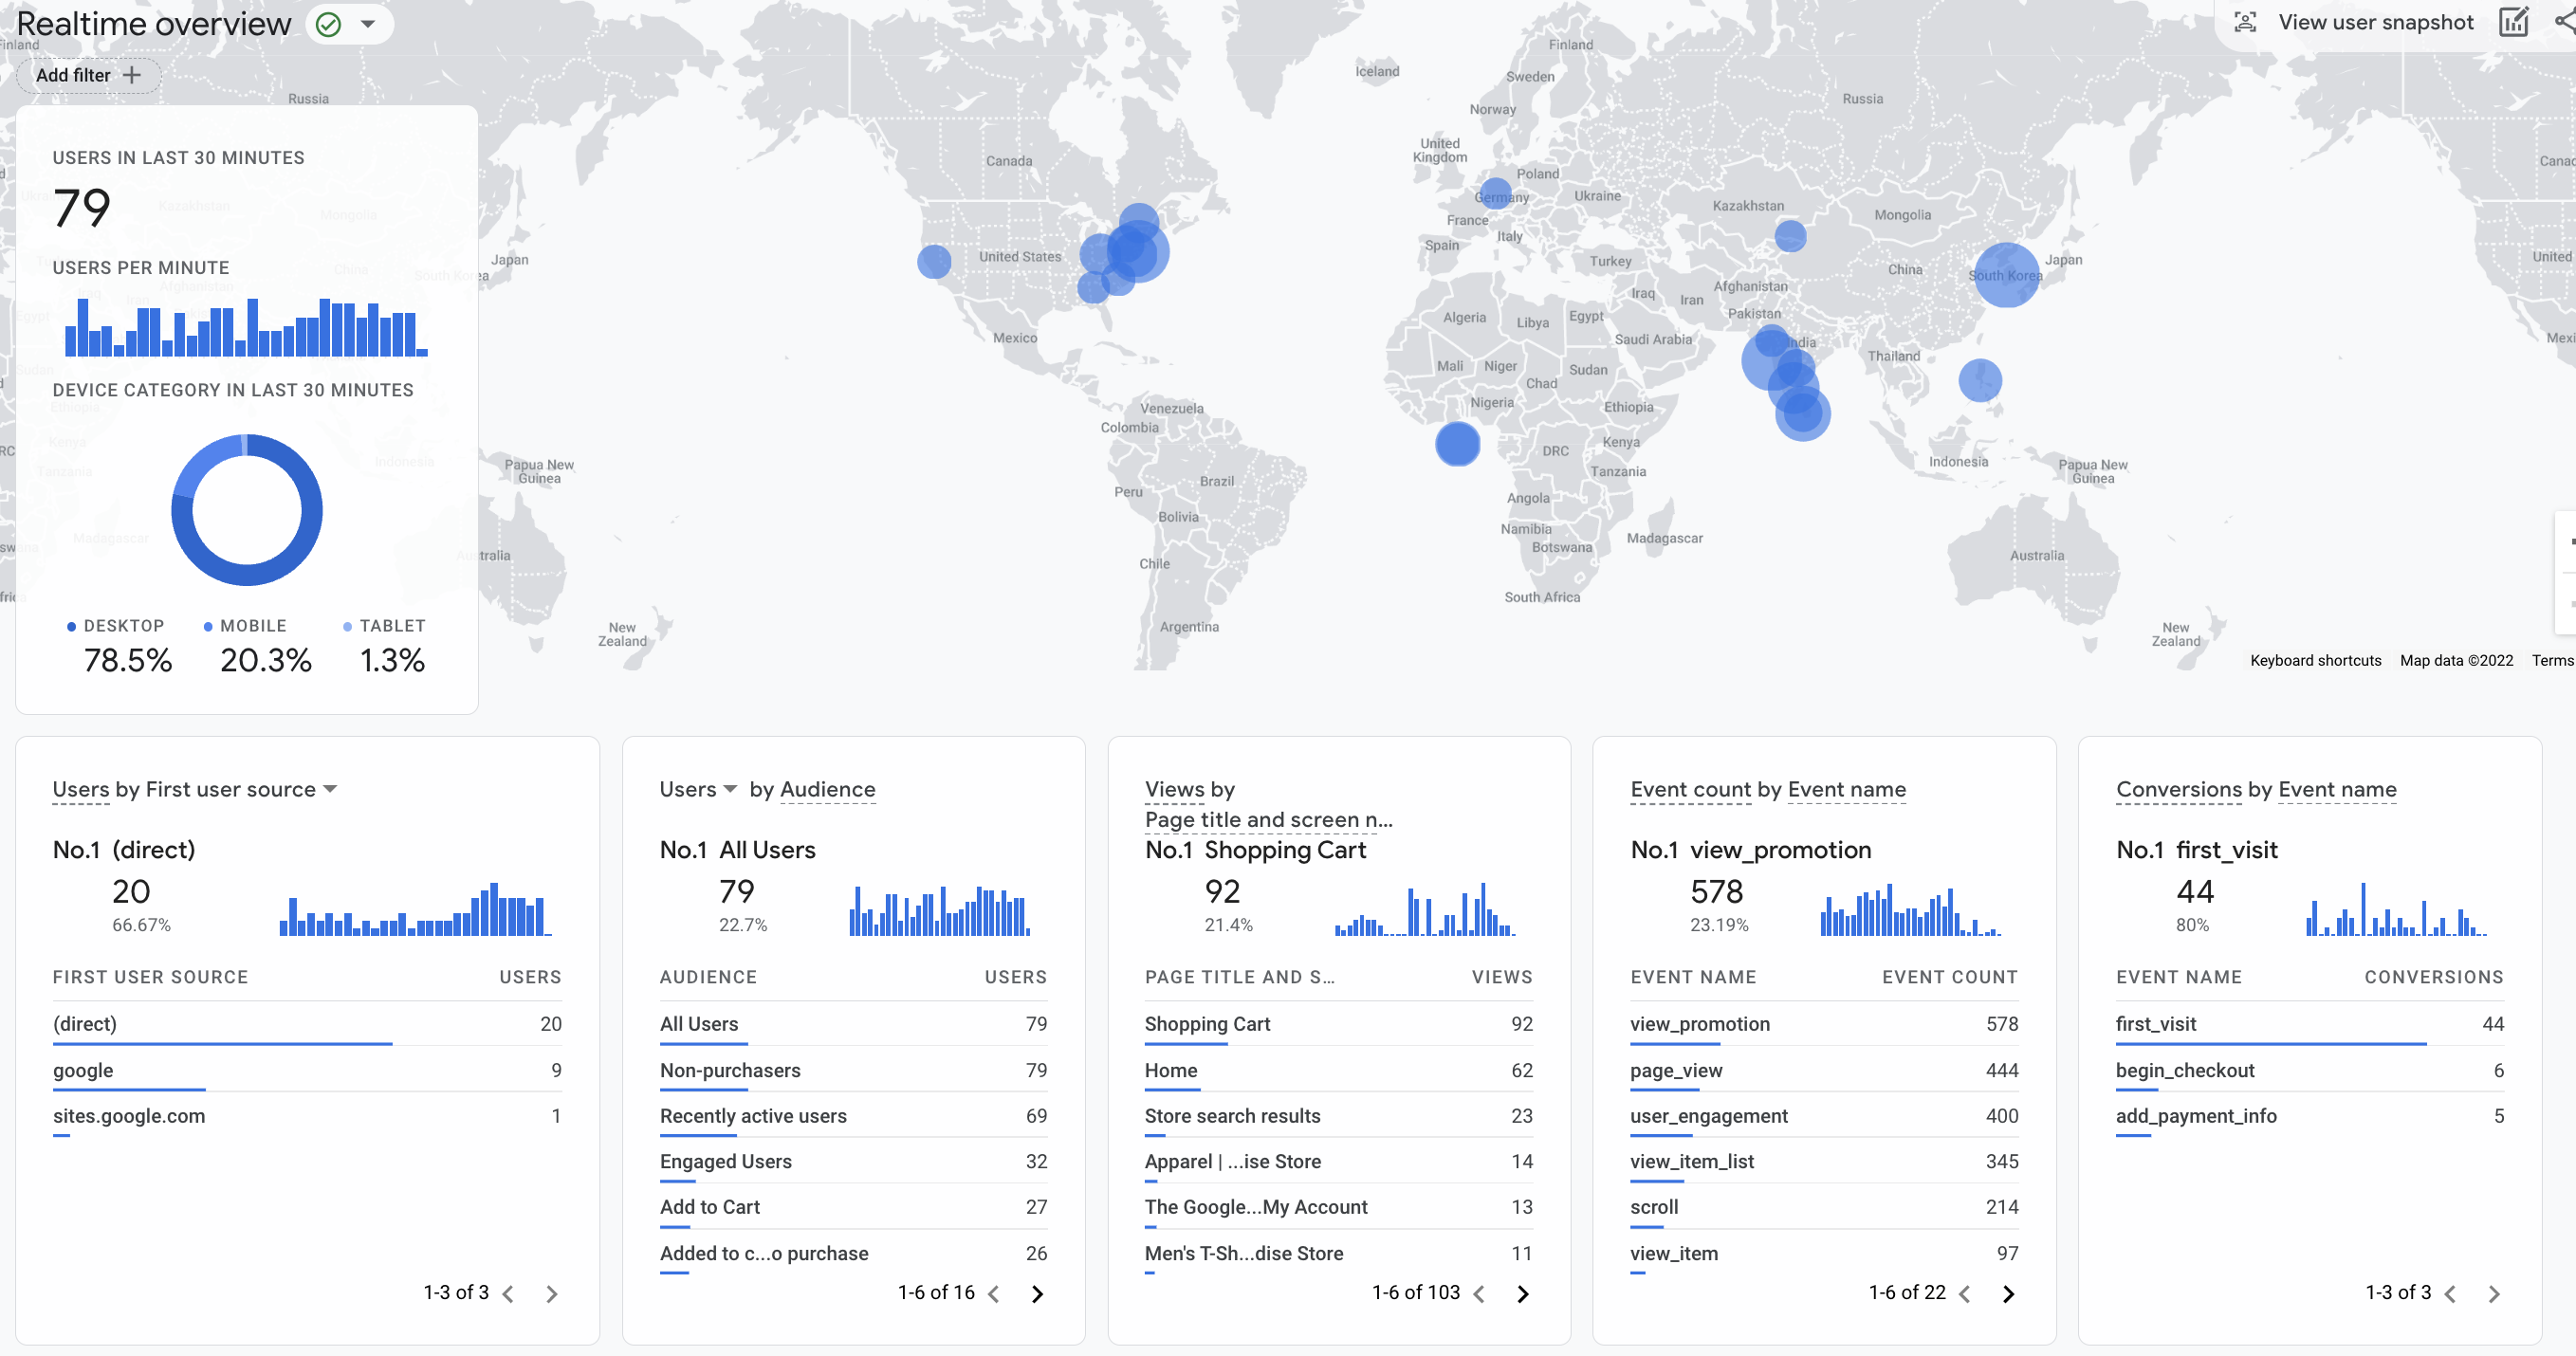
Realtime lets you monitor activity on your website or app as it happens. This is most useful for debugging aspects of your tracking in GA.
Tech overview
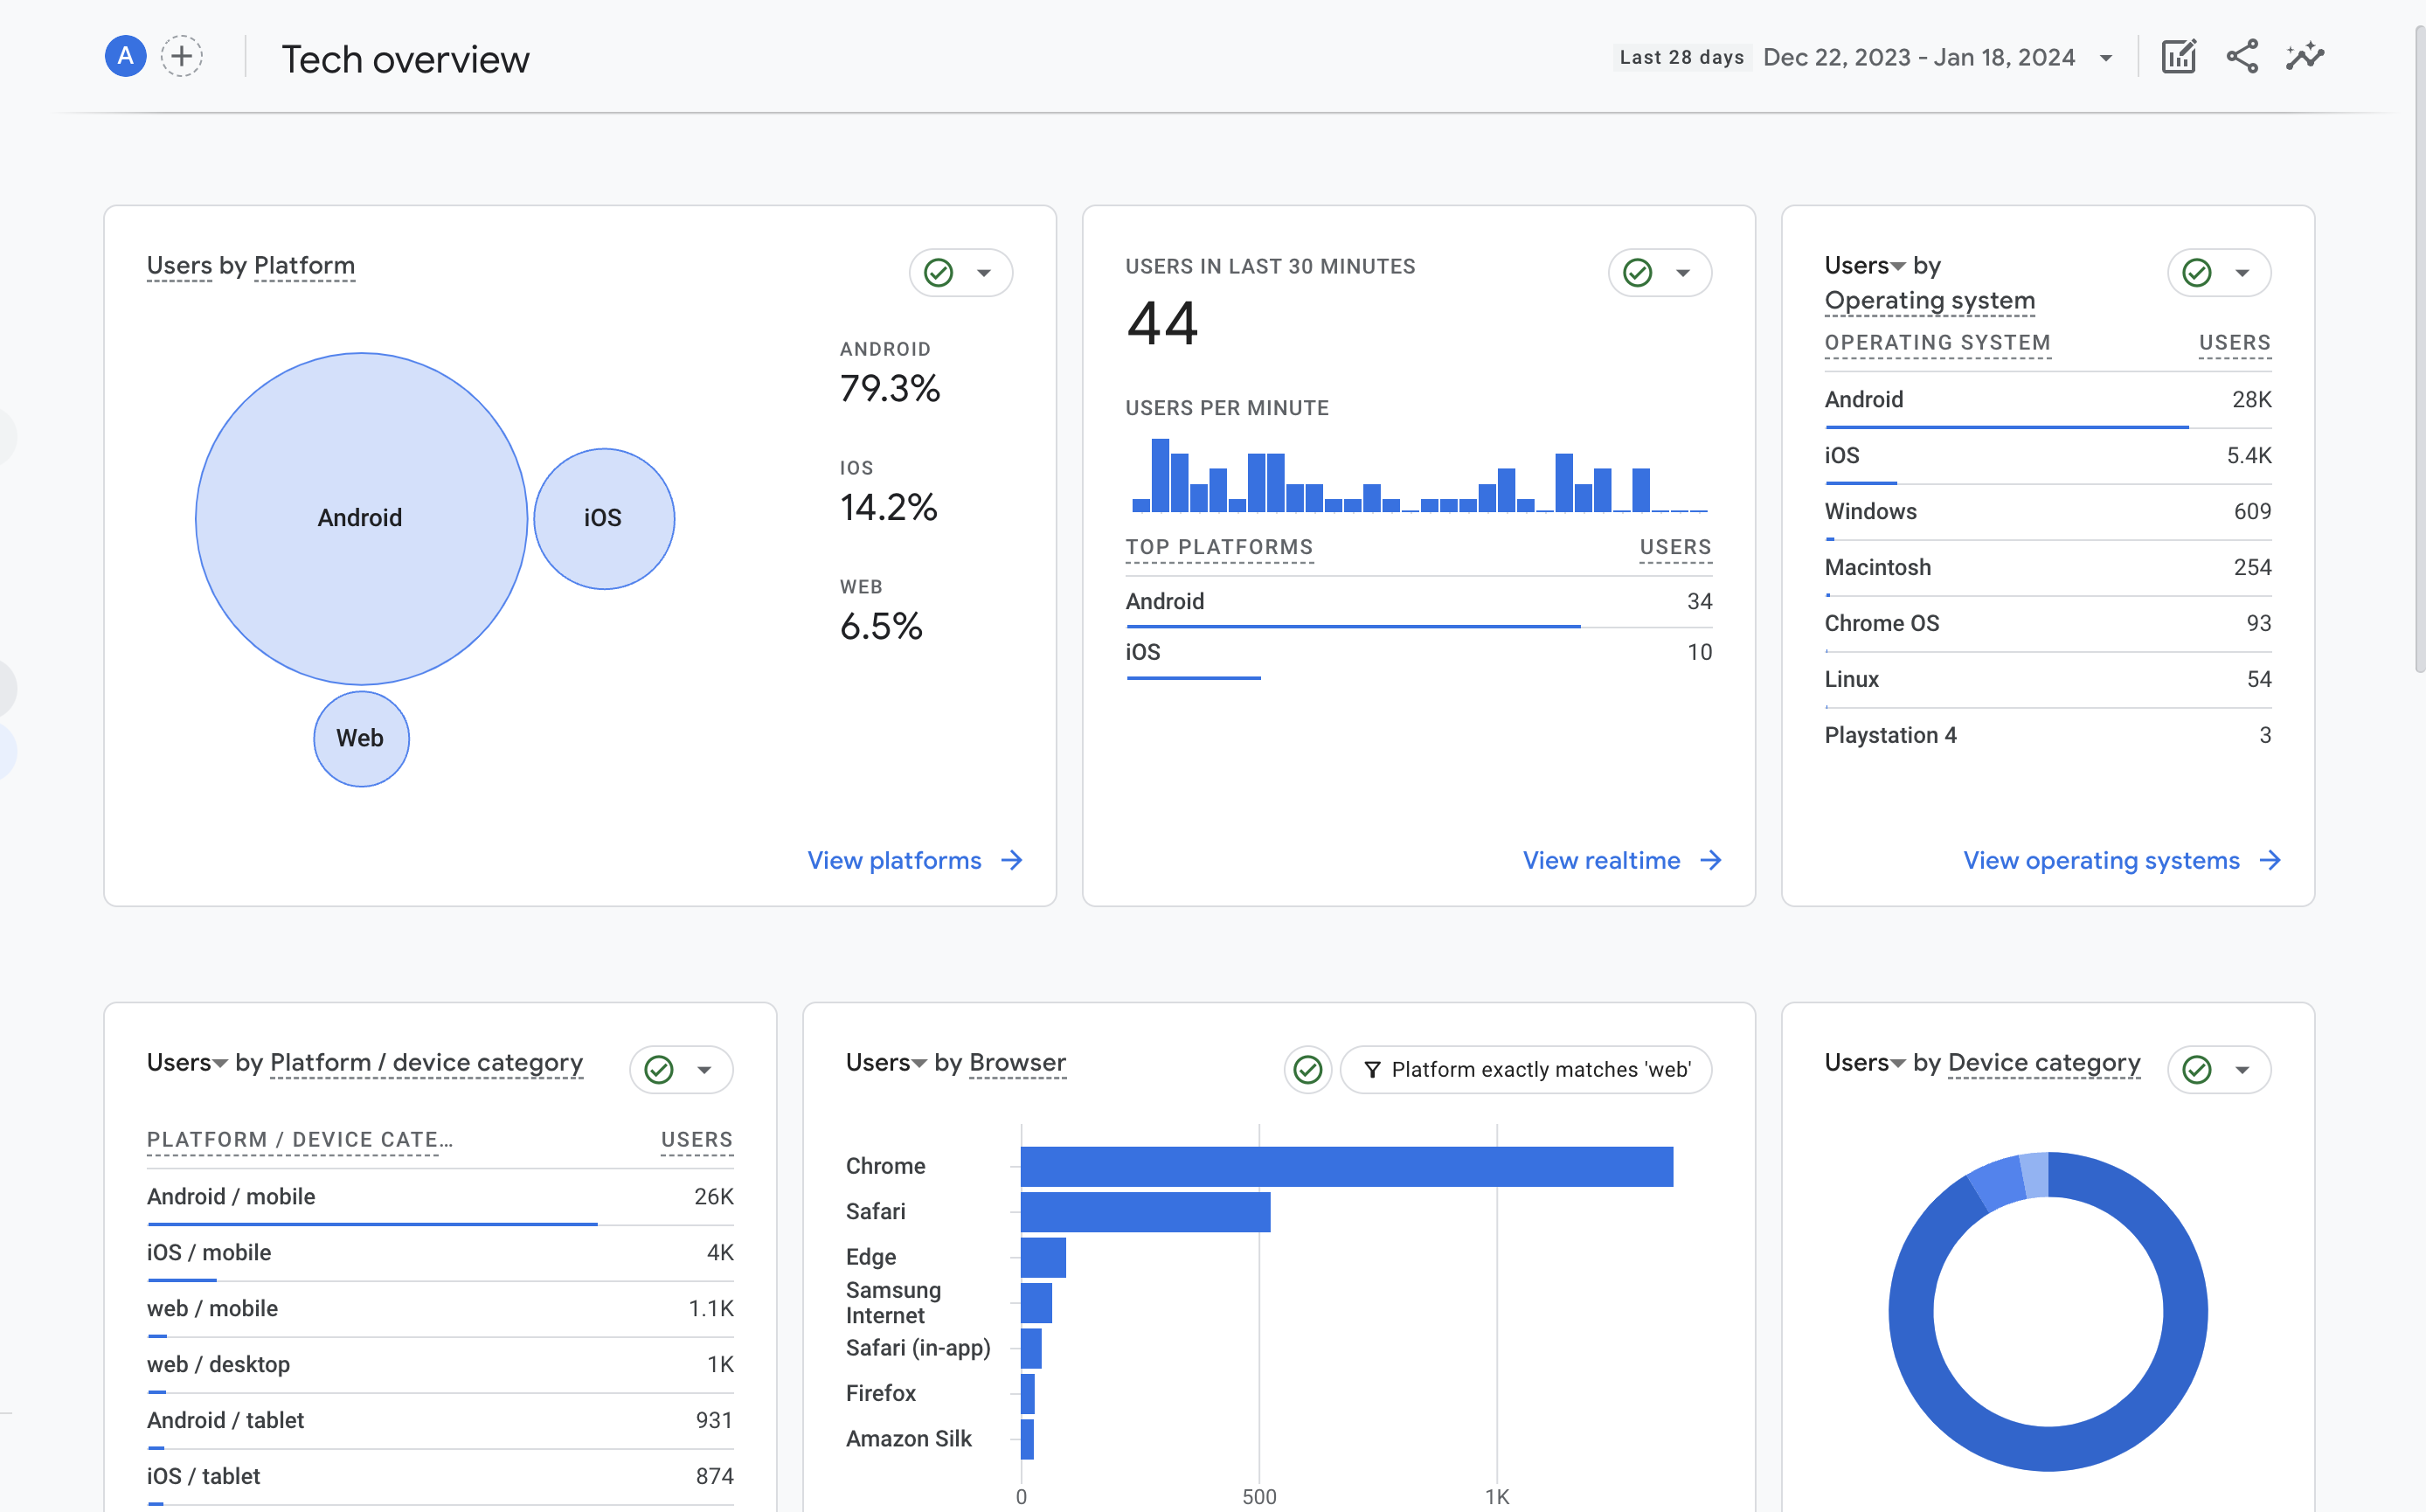
Tech overview provides a summary of the technologies people are using to access your website or app, such as their browser, device model, and screen resolution.
Explorations
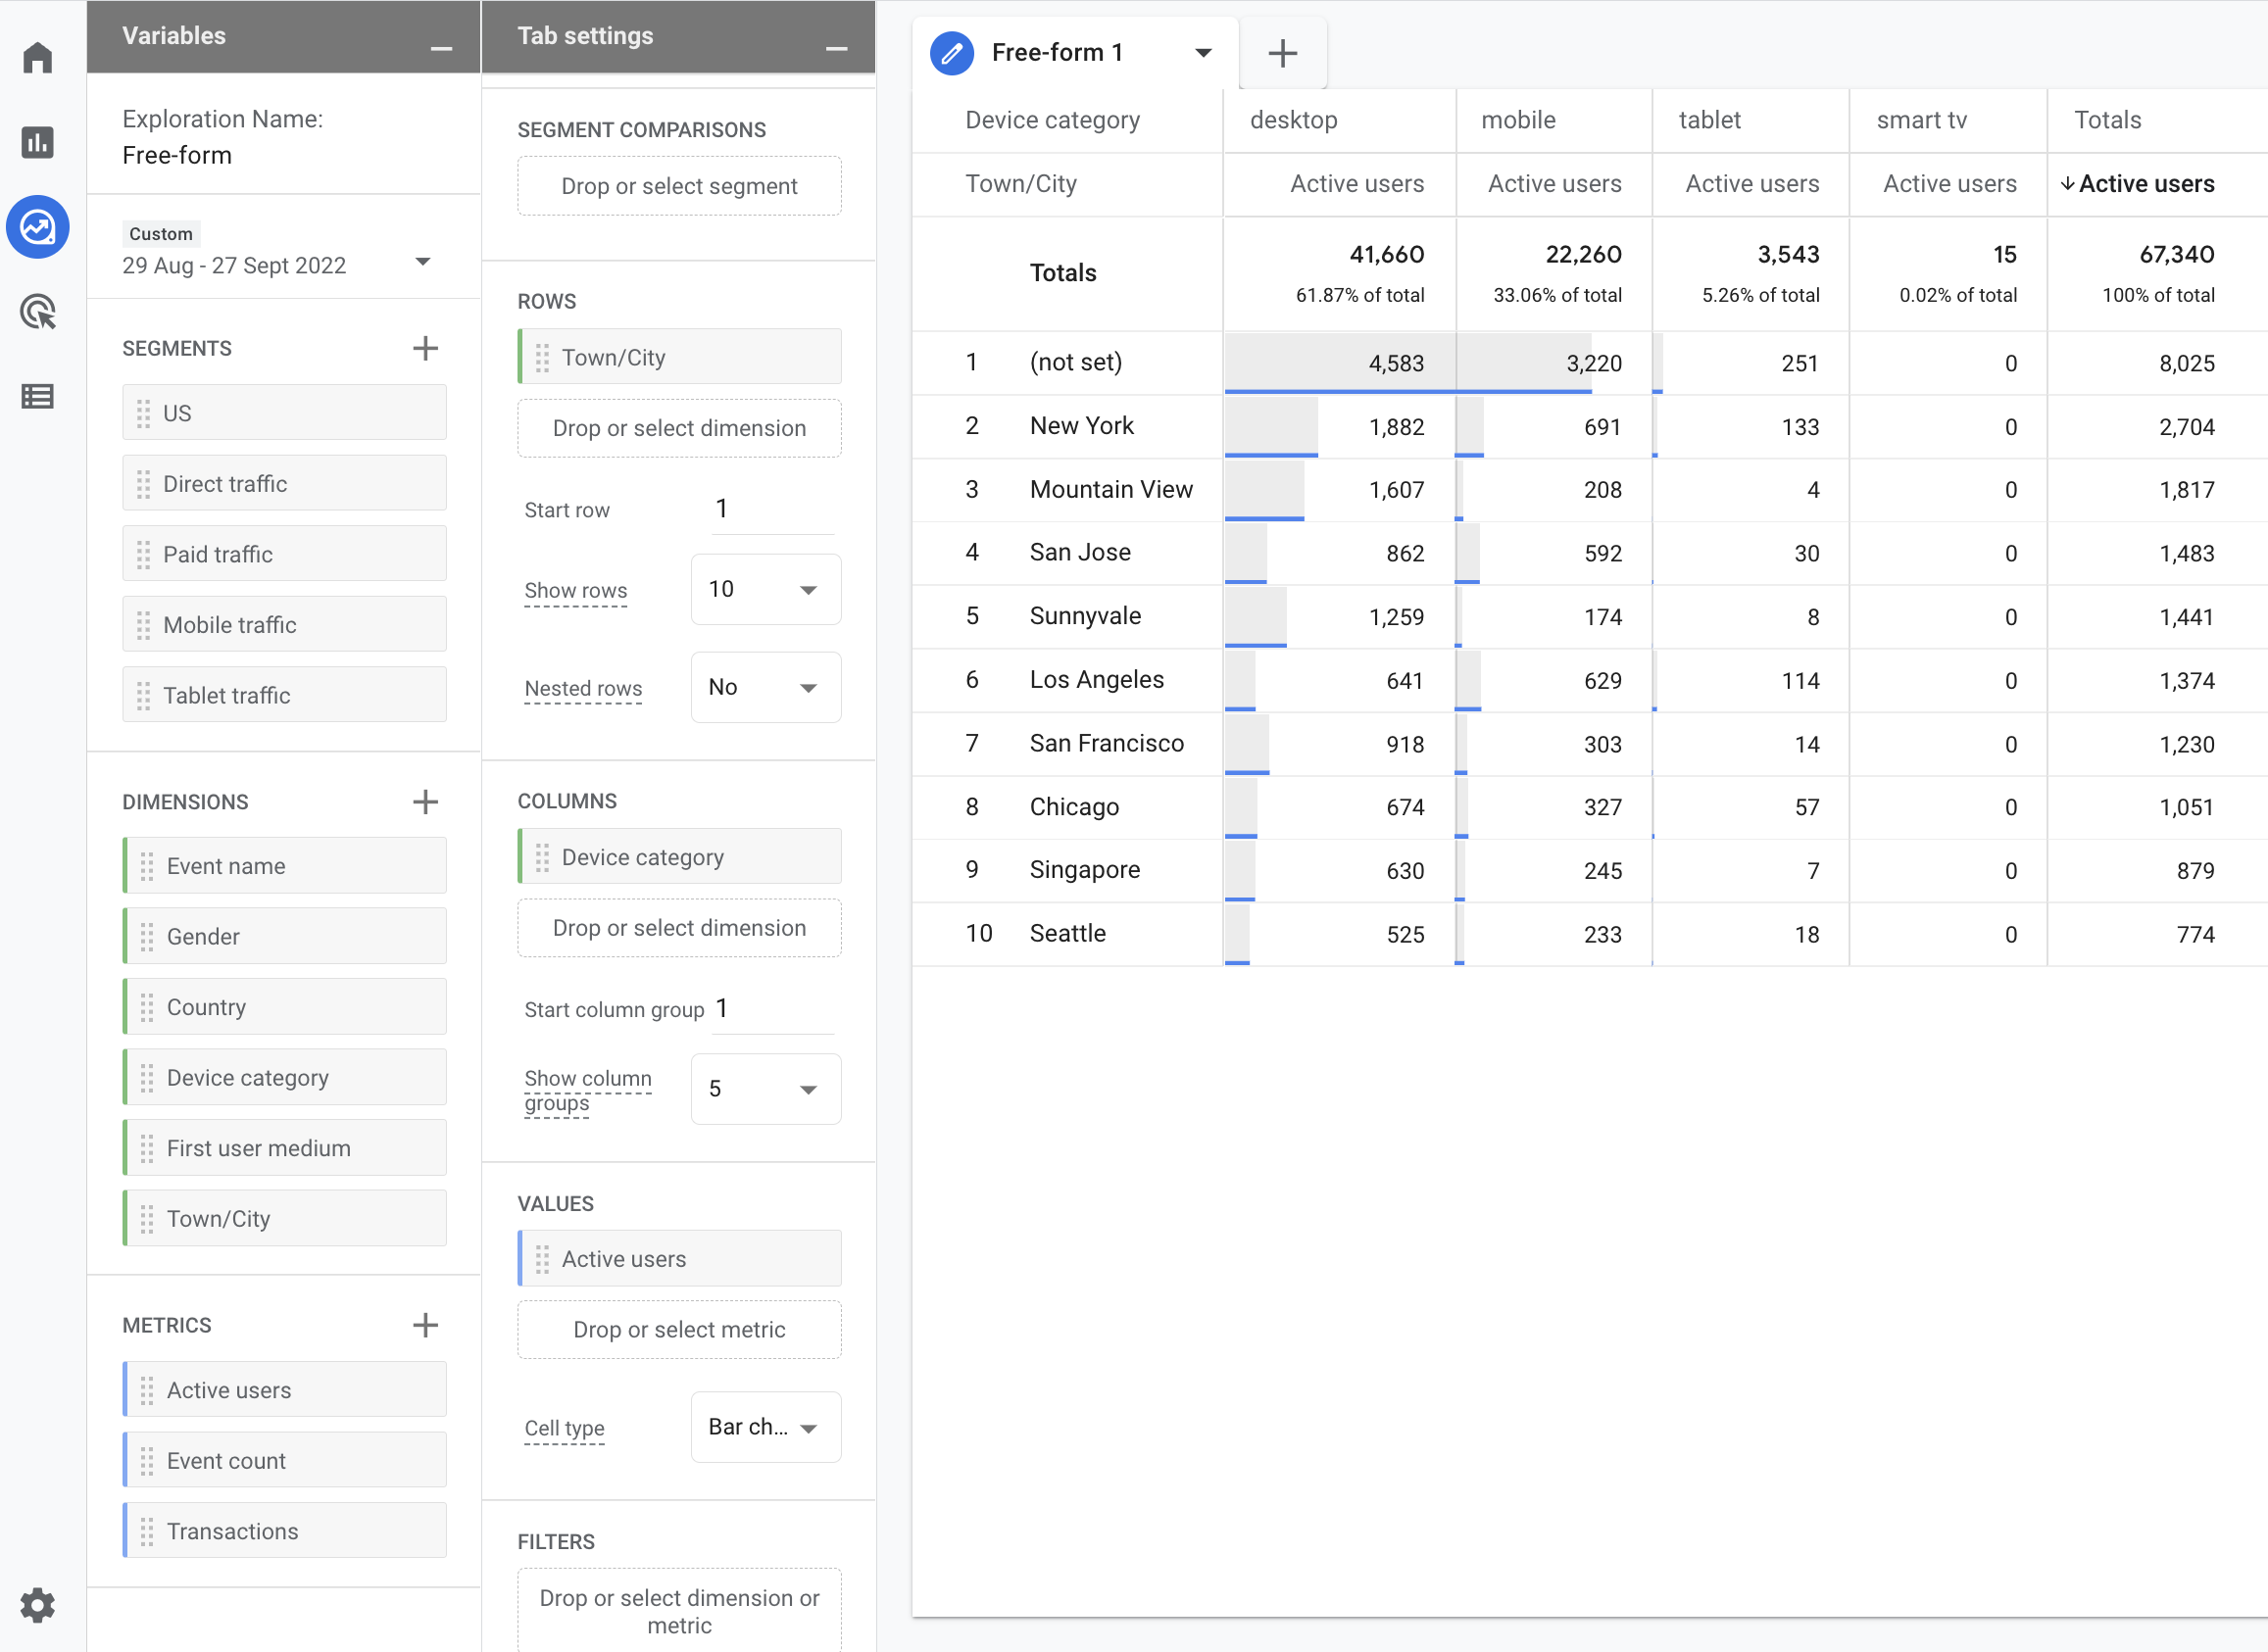
The Explore section is where the power of Google Analytics 4 becomes apparent. With explorations, you can dive into deep analysis. Template reports are available, but the most powerful feature is the ability to create custom ones. You can learn how to create reports like the Shopping Behavior Funnel Report and Sales Performance Report in our YouTube playlist for GA4.
GA4's Explore section also offers the possibility to create visuals in a similar way to Google Data Studio dashboards. You can generate a detailed visualization of user behavior and website performance which you can share with colleagues or stakeholders.
Connecting to BigQuery
Google Analytics 4 also offers a path to creating even more custom analyses or models in BigQuery, and then connecting Looker Studio to visualize this. See how you can set up the BigQuery data export.