Analyzing Octane AI quizes in Google Analytics
In this recipe we’ll explain how you can use Google Analytics to measure the impact of your Octane AI quizes, and see how completion of the quiz varies by marketing channel, geography and end-user device.
This will also enable you to attribute revenue that was assisted by the Octane AI quiz, but not attributed in the Octane AI dashboard, perhaps because the quiz was completed more than 7 days before the purchase or the buyer did not complete the quiz.
You can see the whole customer journey from starting the quiz to purchasing using:
- Littledata’s Shopify to Google Analytics connector
- Octane AI’s Google Analytics integration
Step 1: Add Google Analytics integration in Octane AI
To start tracking quiz interactions into Google Analytics you need to add your property Measurement ID under Integrations > Google Analytics. Here's how to find your Measurement ID.
Once that is added, Octane AI quizes have the following events in Google Analytics enabled:
- Quiz views
- Quiz starts
- Quiz completions
- Each results page
The Google Analytics events sent from Octane dynamically include the quiz name. The event name will always includes [Octane AI] to make it easy to tell which app triggered the event.
| Event Trigger | Dynamic event name |
|---|---|
| Quiz views | [Octane AI] Quiz quiz name Viewed |
| Quiz start | [Octane AI] Quiz quiz name Started |
| Quiz completed | [Octane AI] Quiz quiz name Completed |
| Views results page | [Octane AI] - quiz name - Results Page results page name |
The event names can be edited by going to Connect tab > Google Analytics in the quiz editor, but we recommend leaving the default naming.
Here’s the full guide to adding Octane's Google Analytics tracking.
Step 2: Add Littledata’s Google Analytics tracking
Littledata improves upon the default tracking from the Google & YouTube app by ensuring that all the revenue can be attributed back to on-site visits - including interactions with the quiz.
The main benefits over the Google & YouTube app for tracking are:
- Revenue in Google Analytics matches Shopify
- Accurate attribution to source of visit
- All checkout funnel steps tracked
- Track product lists and clicks
Here's the quick install guide for Littledata - it should take 10 minutes.
From that point onwards - it’s up to you to combine quiz interactions with existing GA4 data, so you can better understand the purchase journey.
Step 3: Build explorations in Google Analytics
To see how Octane AI's custom events affect purchasing you'll need to use the Explore tab. Here’s a quick way to view Octane events:
- Create a new blank exploration.
- Set the dimension to
Event Nameand the metric toEvent Count - Apply a filter where
Event Namecontains the word "Octane"
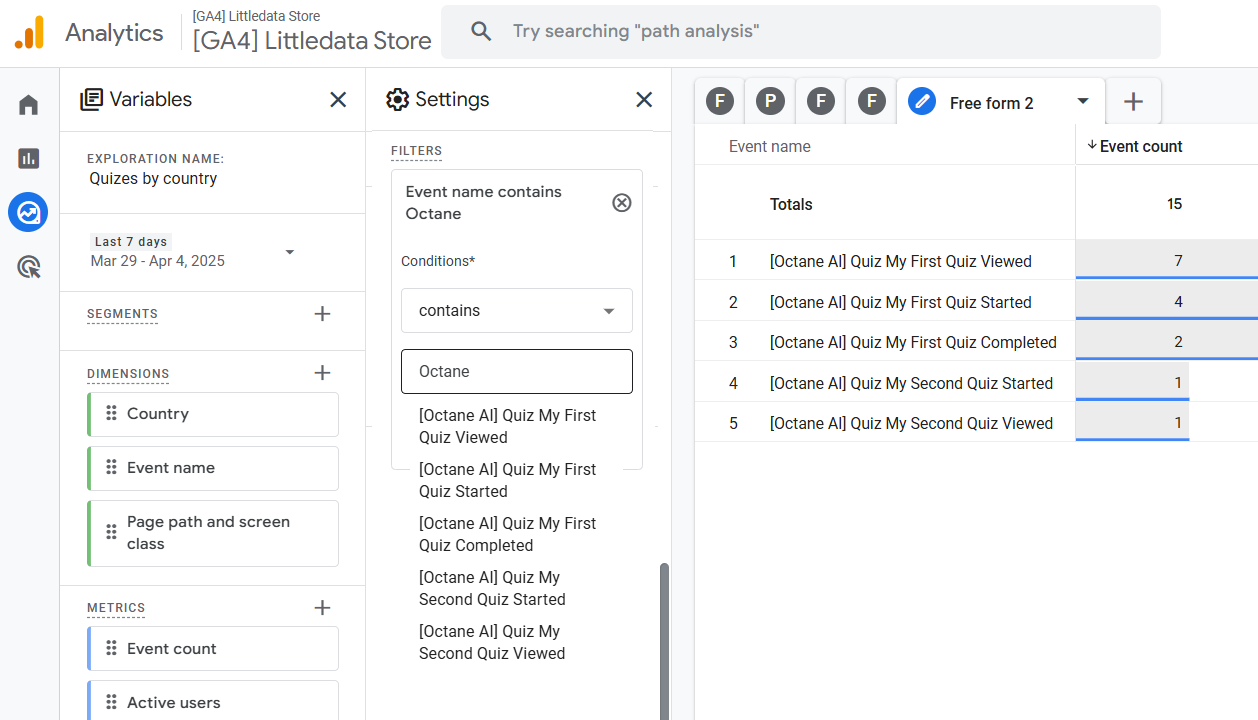
From here, you can break down the data by virtually any dimension you find useful. In the screenshot above we see country and page-path available - but also think about applying device type, source/medium or landing page - it could turn out to be very interesting!
Here are three more examples of explorations you could build in Google Analytics using Octane AI events combined with ecommerce data from Shopify (via Littledata).
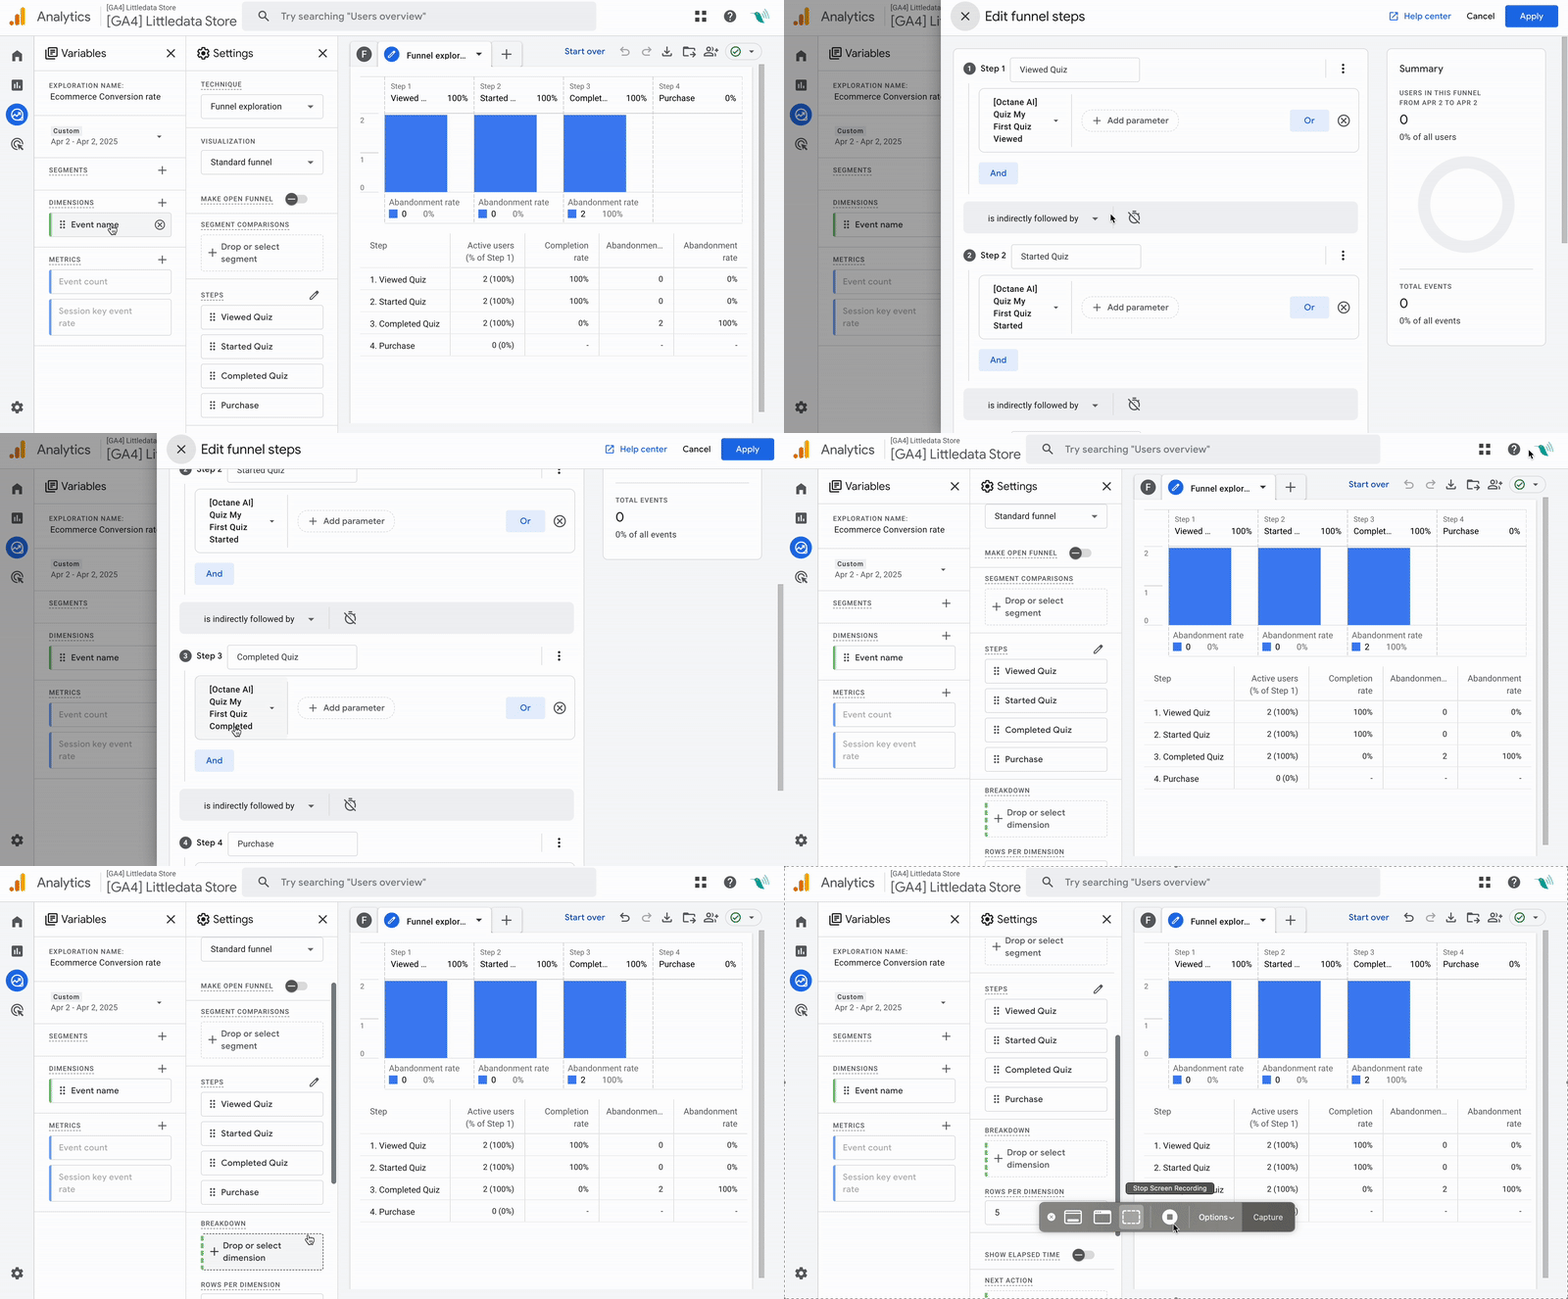
Impact of quiz completion on ecommerce conversion rate
Are visitors who complete your quiz more likely to purchase or not? And how does this vary by quiz name?
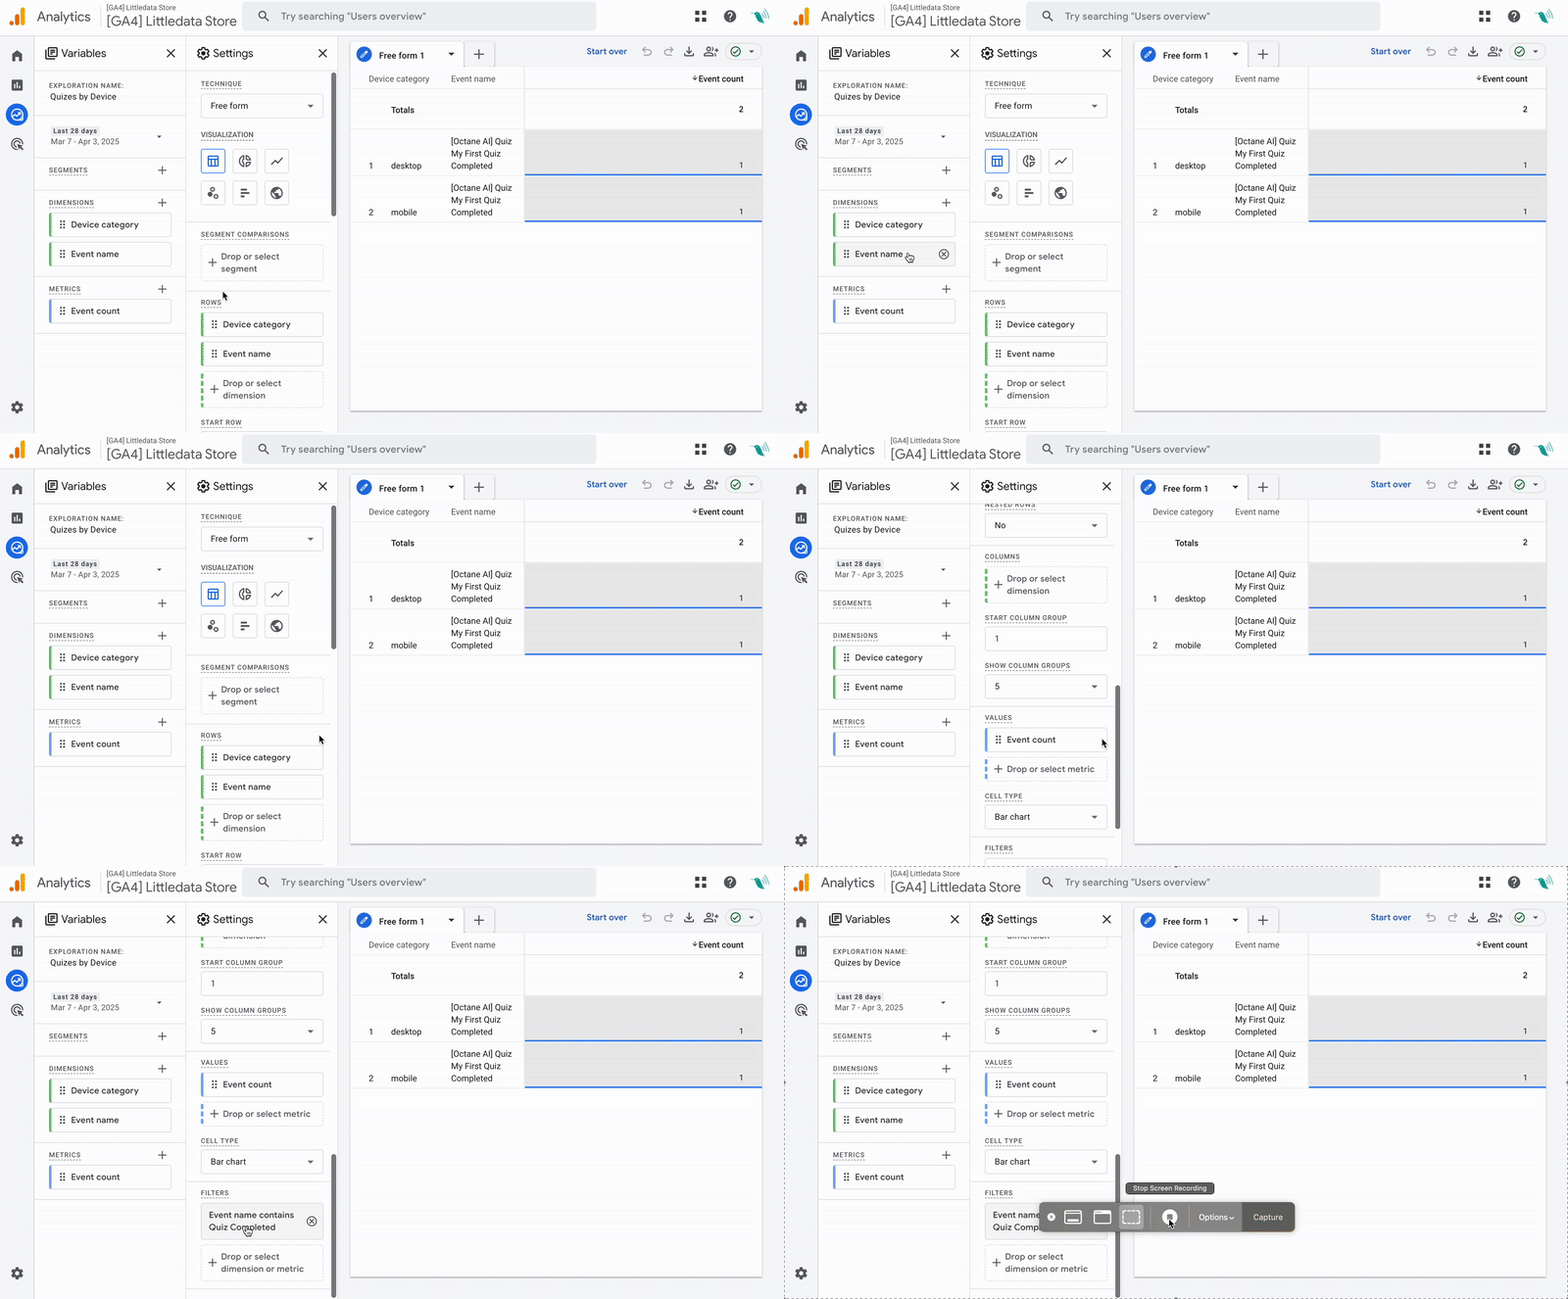
Quiz conversion rate by mobile or desktop device
How is your quiz performance by device? Do you need to shorten the questions for a smaller screen?
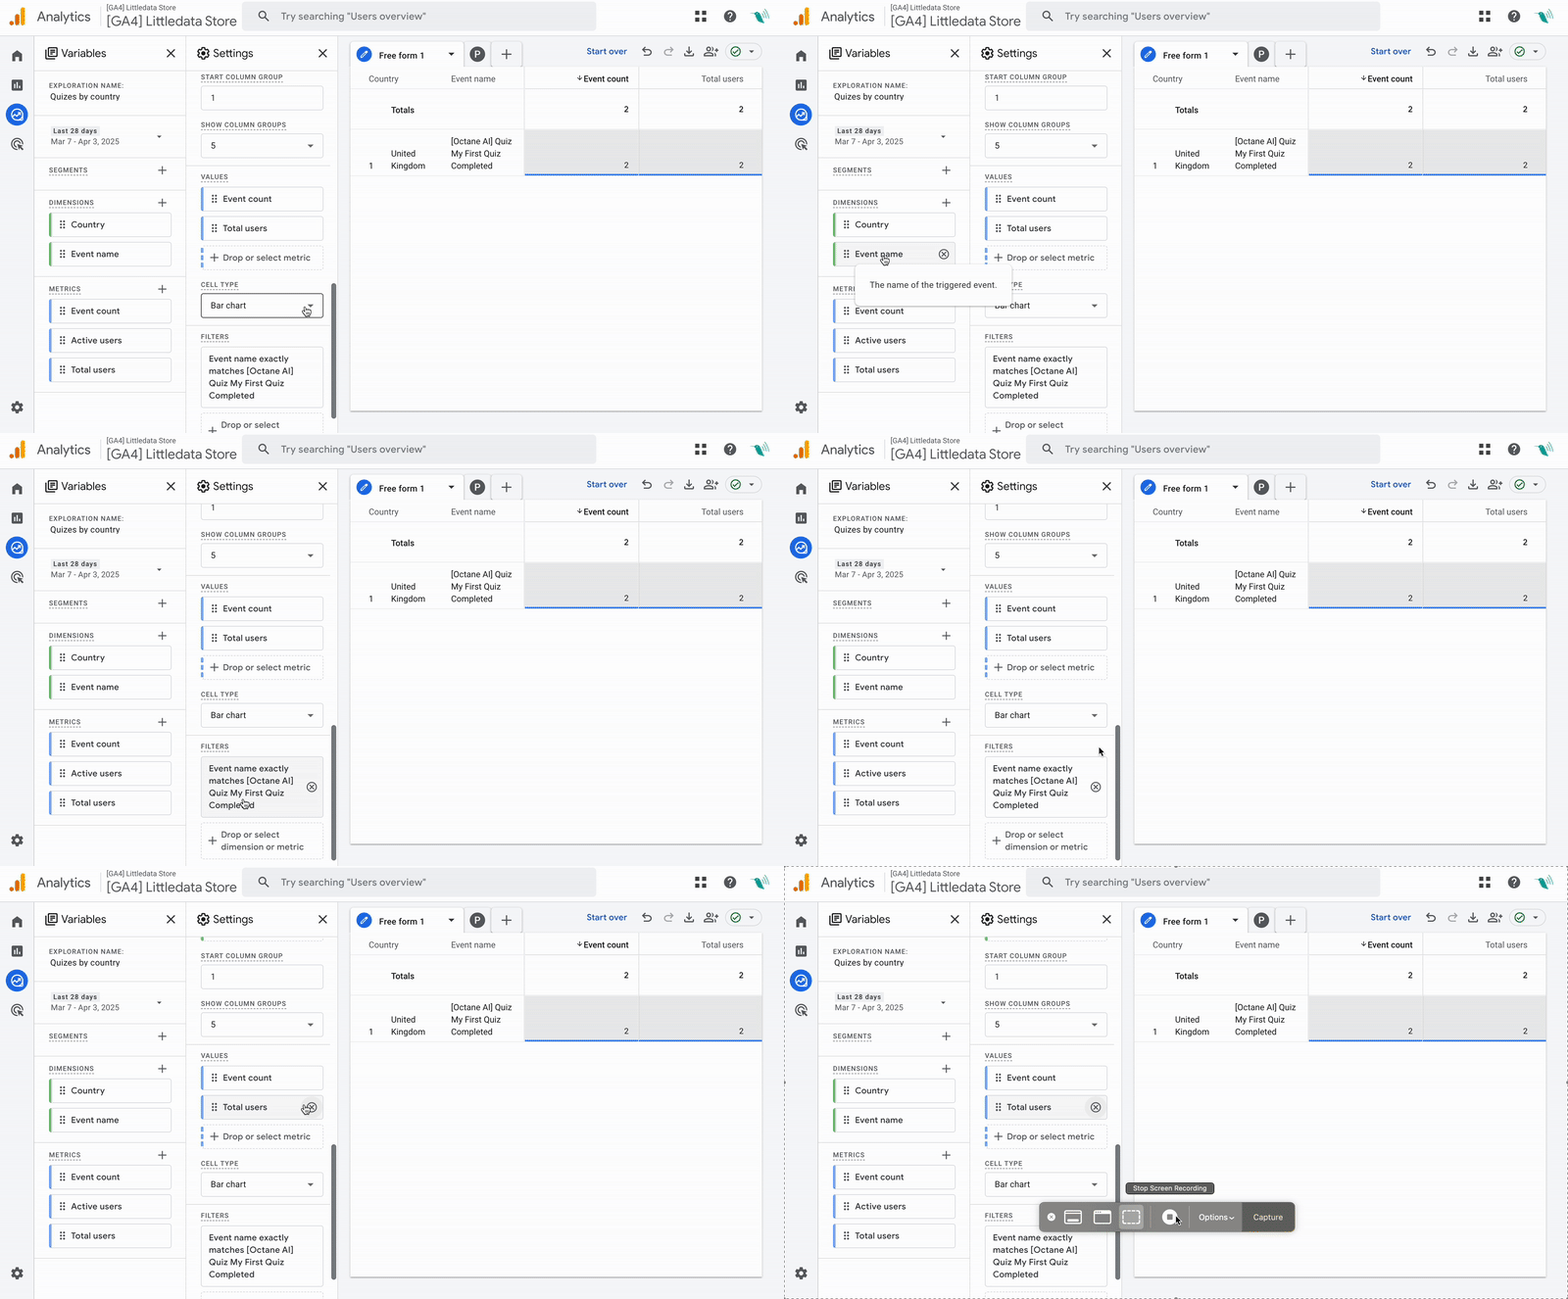
Quiz starts by country
How is your quiz messaging landing in each country?
Building Funnels with Octane AI Events
One of the most powerful things you can do is create GA4 funnels to understand user behavior.
For example:
- Event where the quiz was started (e.g., Dimension
Event Namecontains "quiz started"). - Event where the quiz was completed
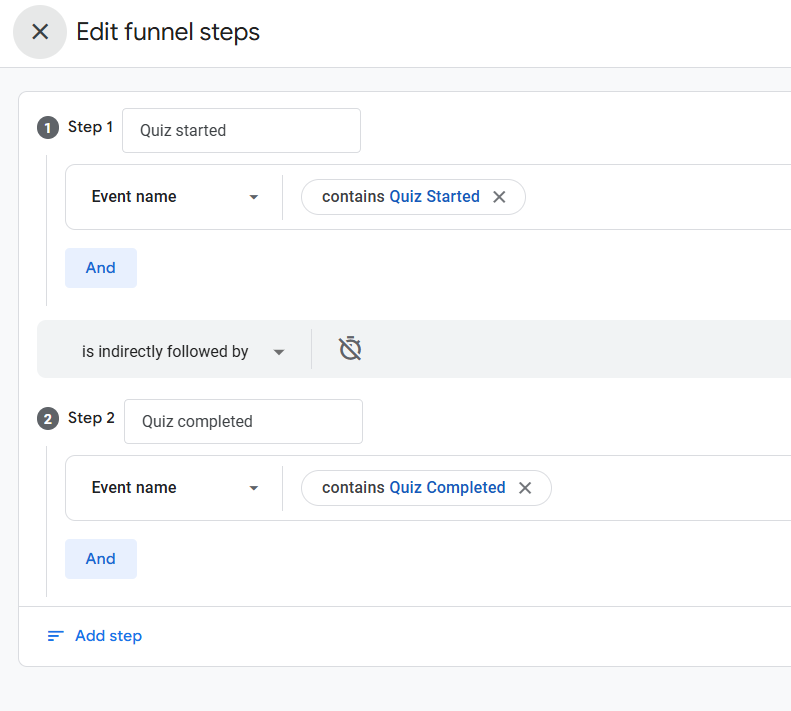
In the next step we'll create a funnel that could be more interesting - instead of Quiz Completed it uses the Purchase event as the final step.
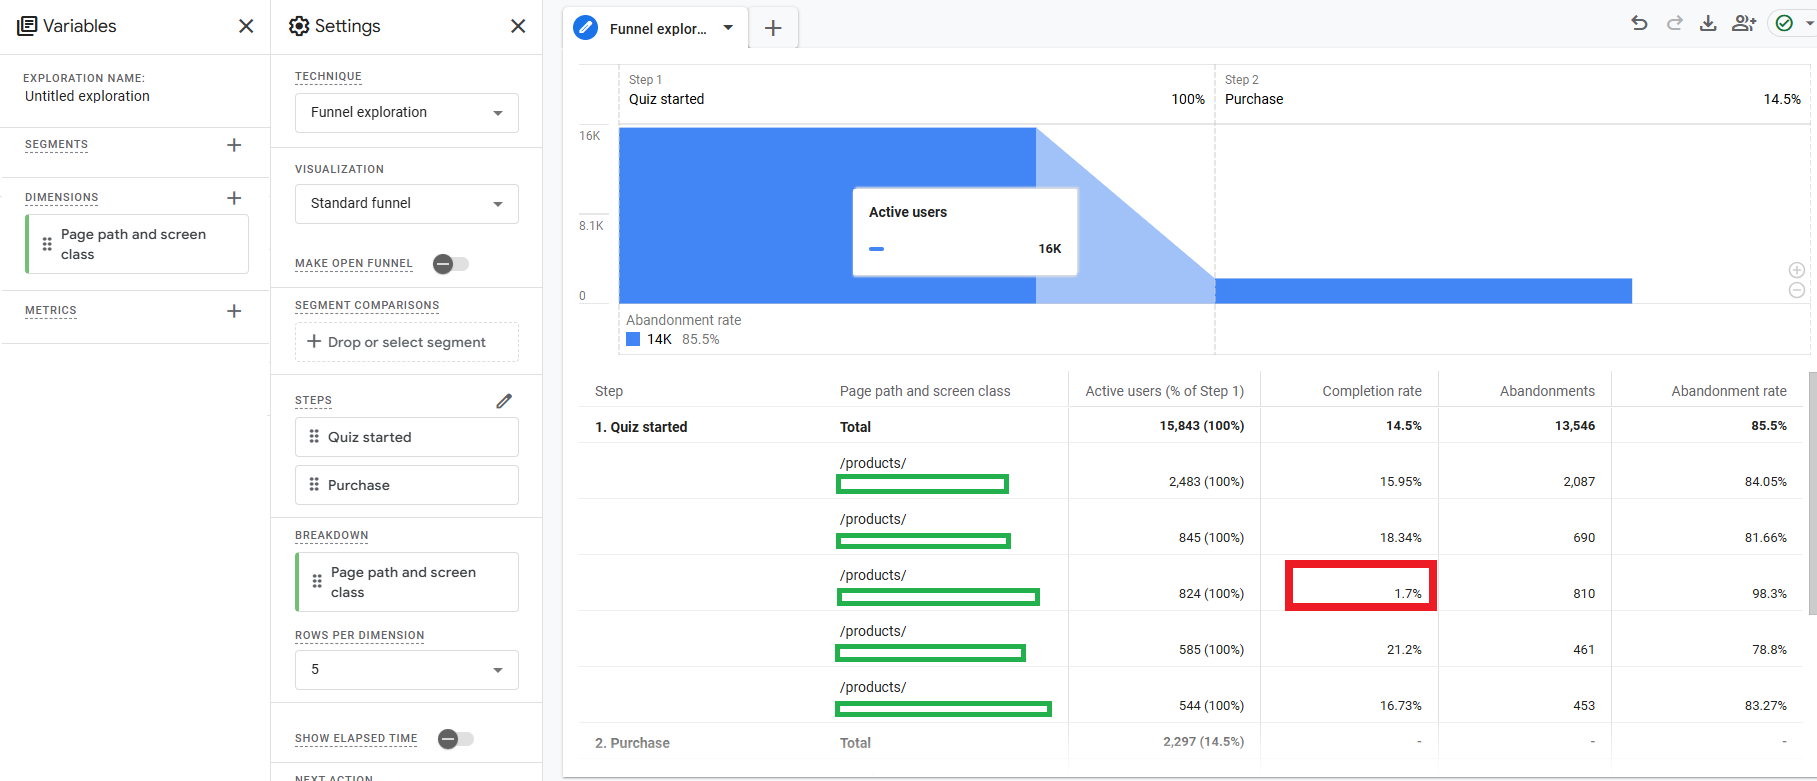
In the report above we use GA4 superpower to break down funnels by dimensions like Page Path, meaning that we can see which product pages drive the most quizzes, but also which ones lead to purchases.
In this case the product page at position #3 had a high number of quiz starts but a very low completion rate compared to others — an important clue for performance marketers to investigate.
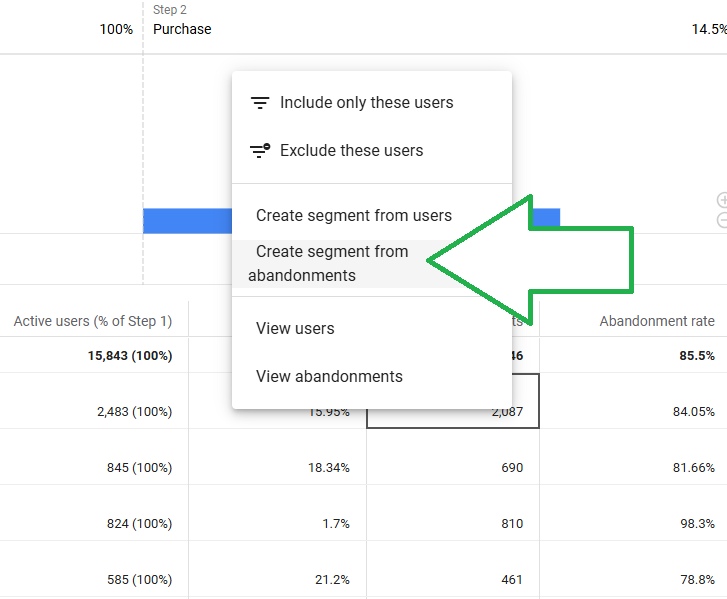
You can right-click on any number in the funnel table and create a segment — for example, people who abandoned the quiz
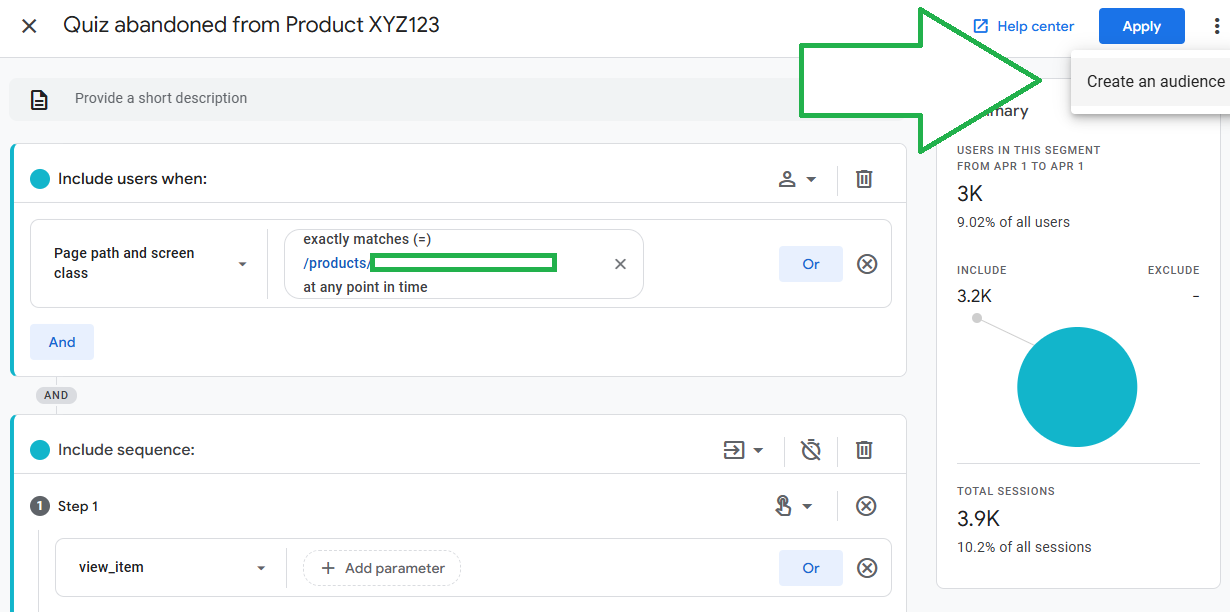
You can even turn that segment into an audience for retargeting in Google Ads:
Segmenting Sessions With and Without Quizzes
Another way to slice the data is to create segments in GA4 - let's compare sessions that included a quiz vs. sessions that didn't:
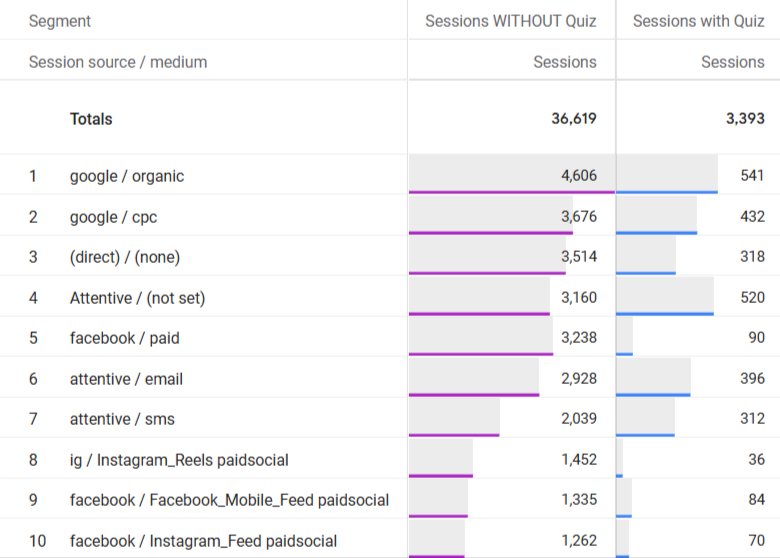
In this case we can observe that:
-
About 10% of sessions included a quiz.
-
Yet these sessions brought in almost as much revenue as the 90% of sessions without a quiz.
-
Sessions from Facebook/Instagram had a low quiz start rate — a useful signal for the Facebook Ads team to investigate messaging or audience targeting.
But if we further enrich this report by adding relevant ecommerce KPIs like Gross Purchase Revenue, we see that quiz engagement means very high return:
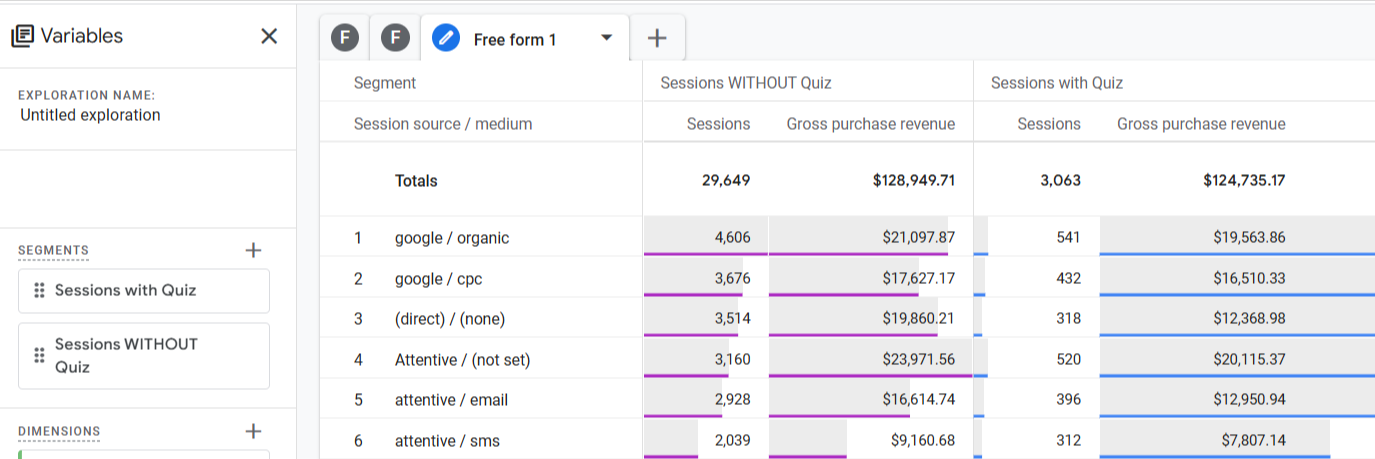
While the volume of sessions that have quiz interactions makes up around 10% of all the website traffic, the revenue tied to these sessions is almost half of all the money coming in, yay!
Behavioral Exploration: What Happens After a Quiz?
Finally, you can use Path Exploration in GA4 to analyze what users do after interacting with a quiz.
By setting the branching point as an Octane AI quiz event, you can uncover common navigation paths — and identify opportunities to optimize the post-quiz experience (like guiding users to product pages or checkout):
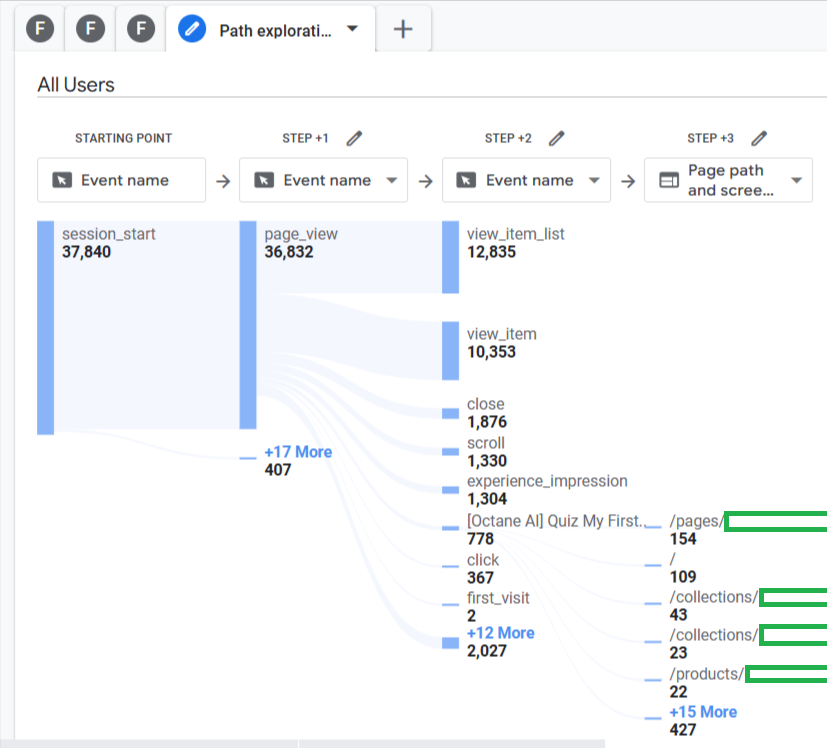
Here's more you can do with behavior reporting in GA4.
Going further
Connecting Octane AI with Google Analytics doesn’t just give you more data — it gives you smarter data.
You’ll uncover friction points, identify your most valuable quiz interactions, and even build retargeting audiences with a few clicks.
And here are some other analyses that Littledata's app enables:
- See how quizes drive subscription purchases
- Understanding which marketing campaigns drive quiz completions
- Linking online interactions of quizes with offline purchases (POS or draft orders)