GA4 Onboarding - Required Admin Settings
Welcome to the world where ALL your Shopify Purchases are tracked!
Here are a few required actions you need to take upon installing Littledata to ensure that your investment in our tool yields the highest possible data quality in Google Analytics.
We have split these actions into three sessions:
- Day 1: Ensure you have the right installation
- Week 1: Between 2 and 7 days after installation (as GA4 officially states a 24-48 hour lag in the reports, we want to make sure the sent data is visible in GA4)
- Week 2: Between 10 and 20 days after installation(depending on the volume of traffic your website receives)
Actions on Day 1
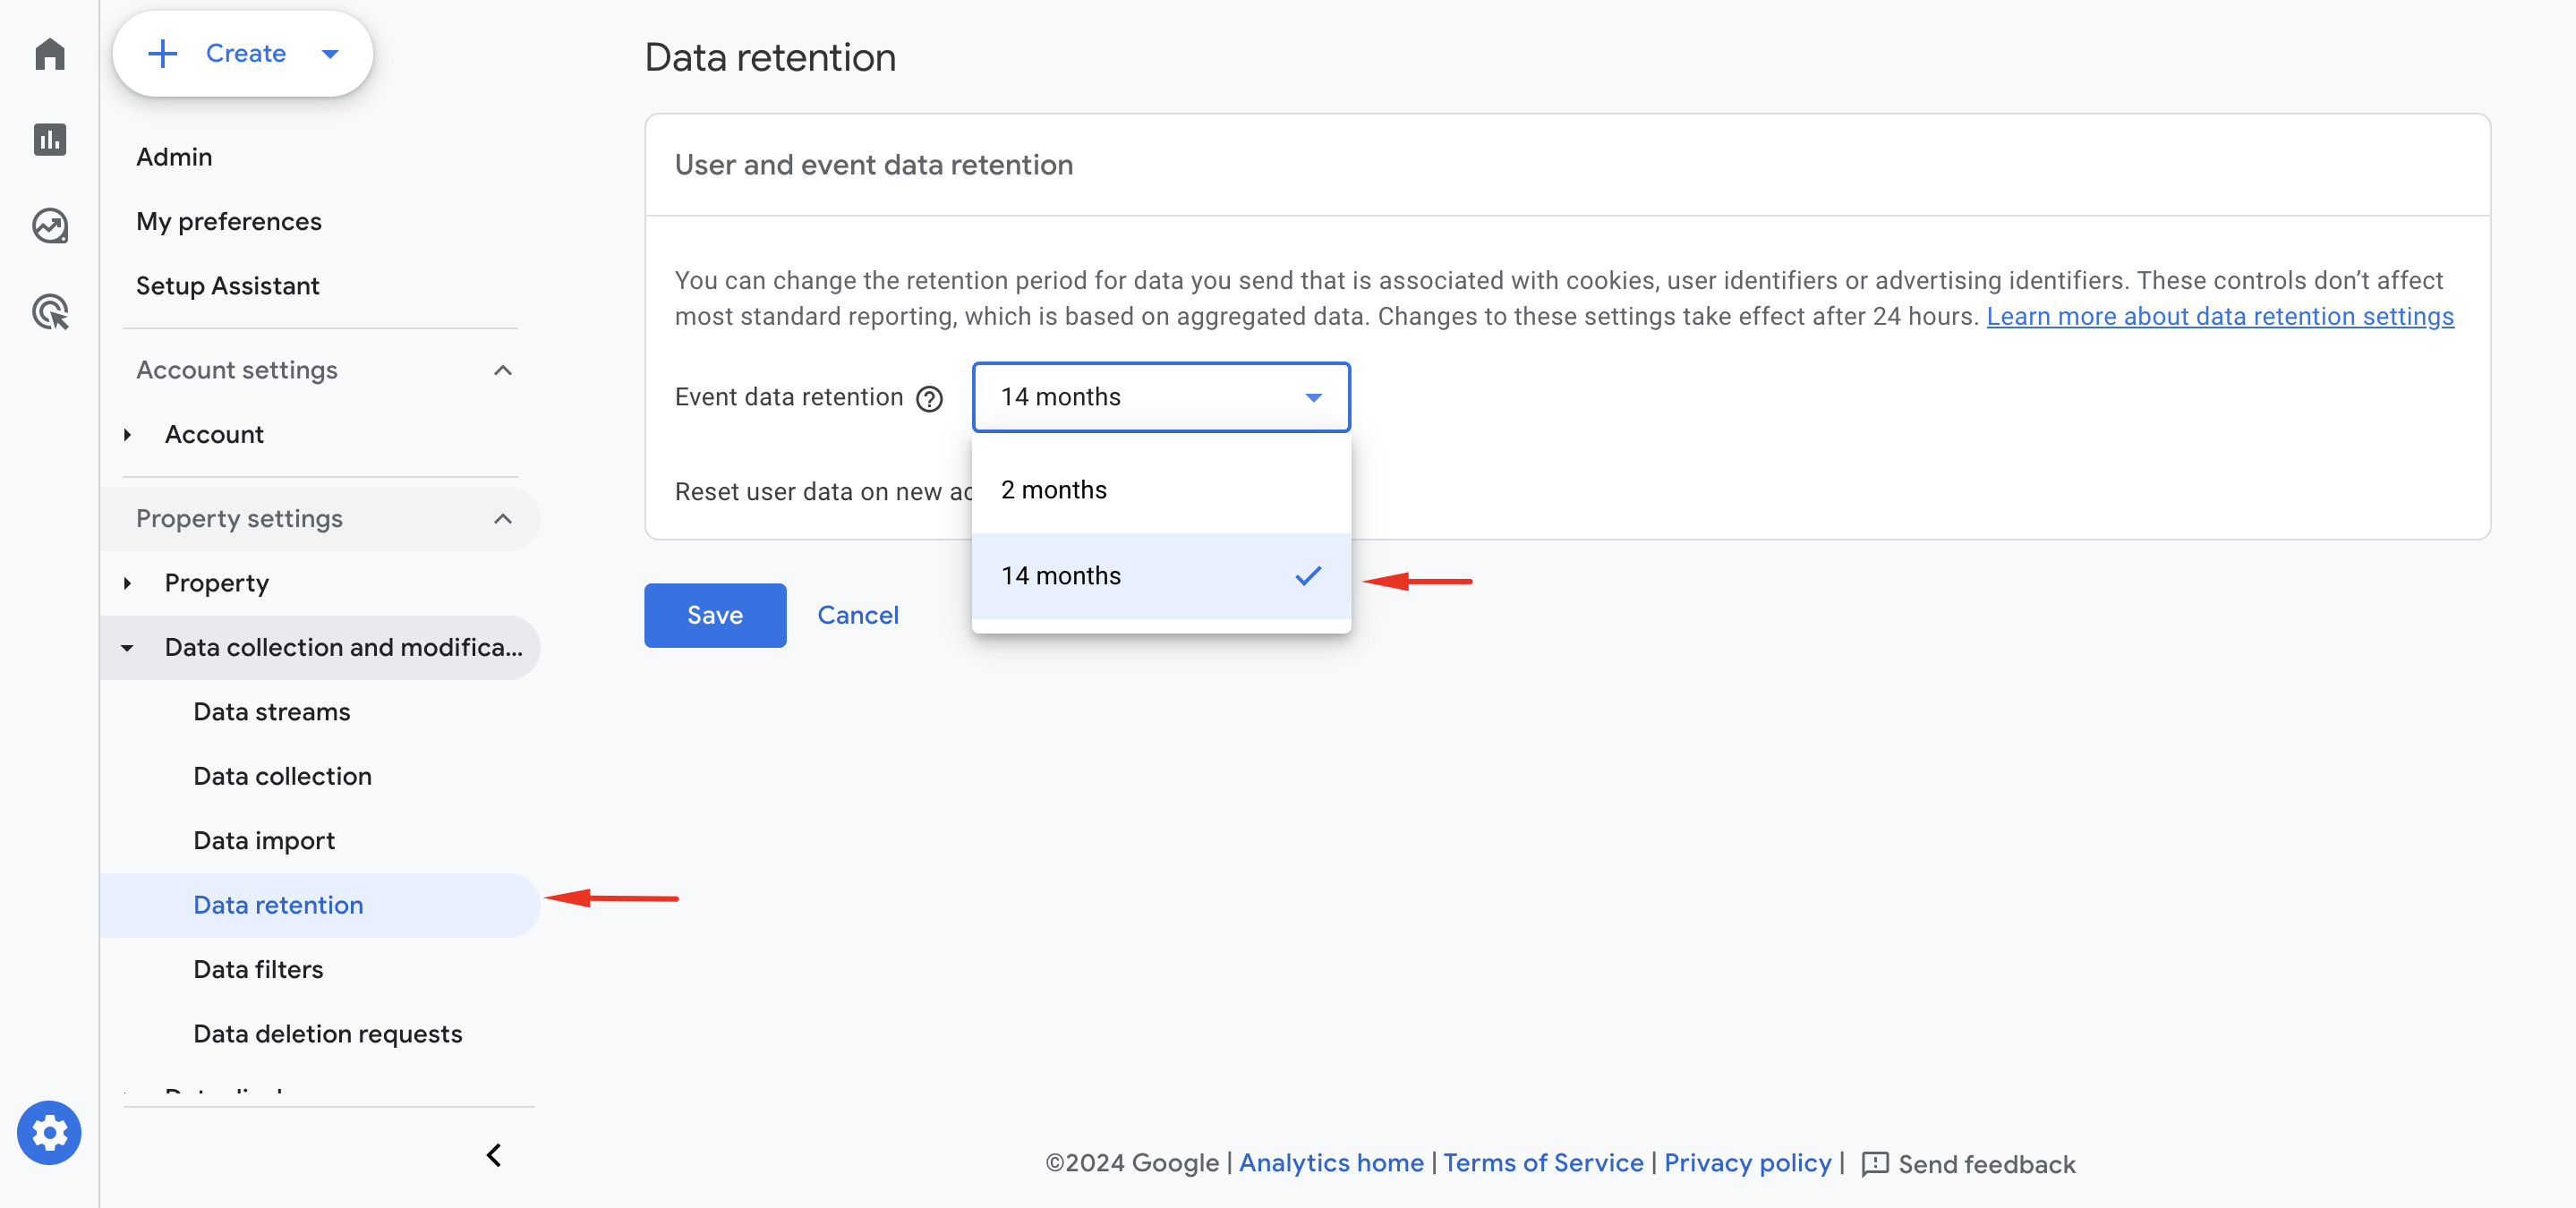
1. Extend data retention in GA4 from the default 2 months to the maximum 14 months
Are you aware that the details of a customer's visit in GA4 completely disappears after 60 days by default?
The reason behind Google's 2 month default data retention is unclear - our guess would be partly between protecting user privacy and reducing server load.
Anyhow, stop reading this right now, open your GA4 admin section and change this setting!
If you prefer watching a video that explains the all the steps (in a somewhat casual style):
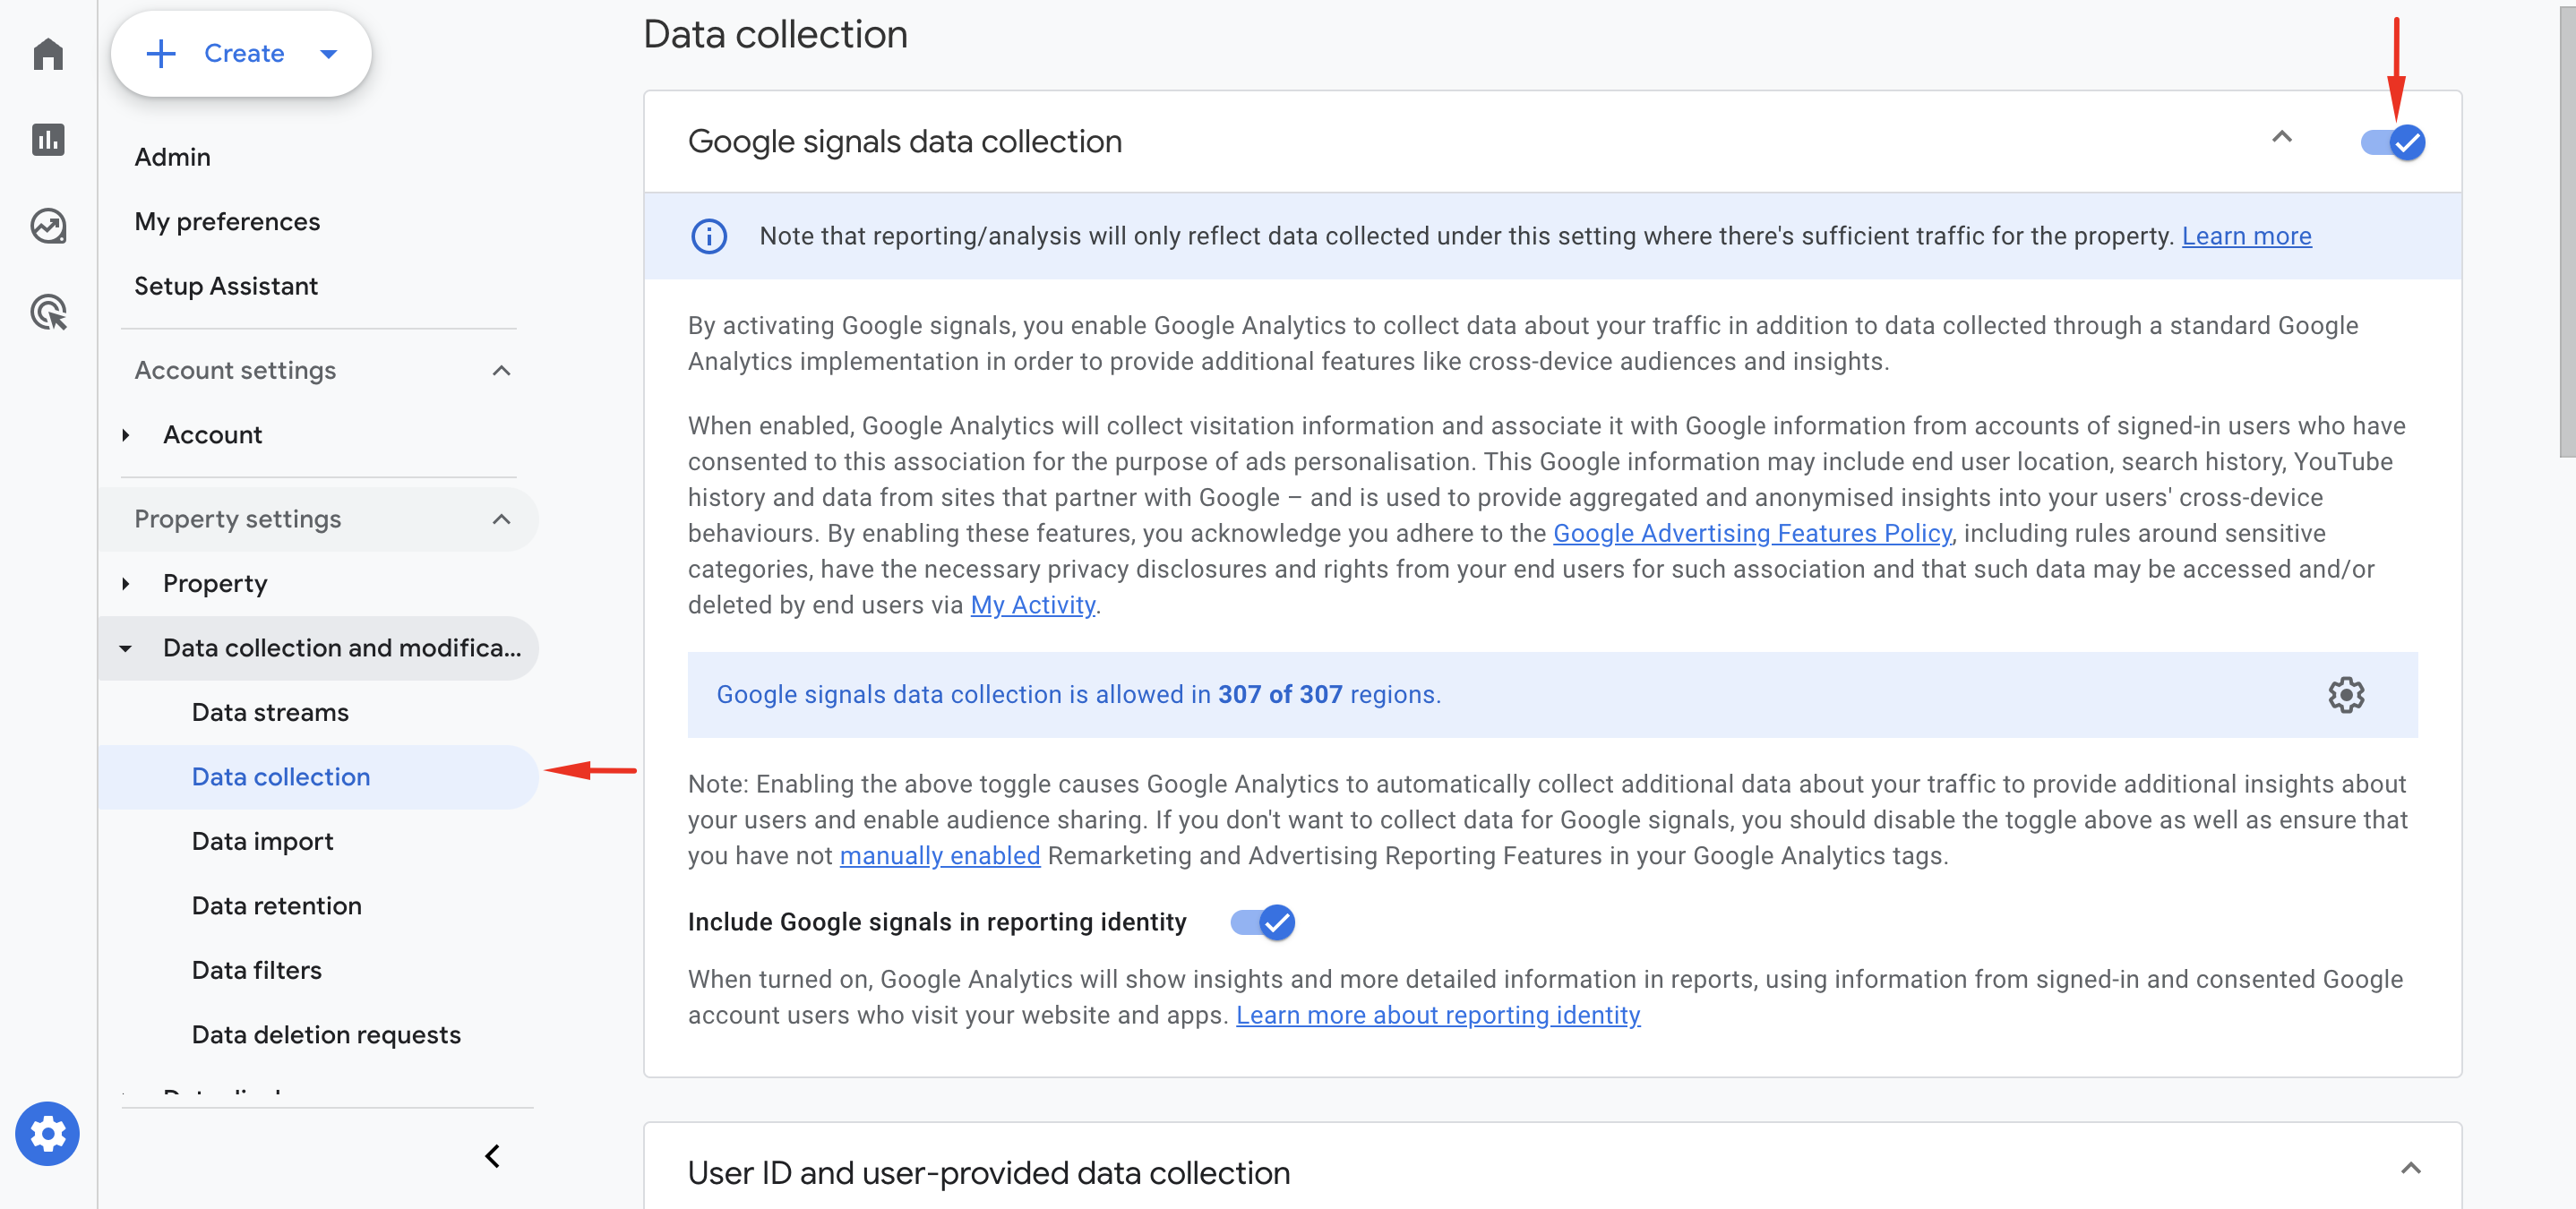
2. Turn on Google Signals
When enabled, Google Analytics will collect and associate info from accounts of signed-in Google users who have consented to this for the purpose of ads personalization.
Simply put, your remarketing audiences will NOT flow into connected Google Ads accounts without this setting being active.
The downside of Signals being turned on is thresholding, which means that low-count individual records are truncated from GA4 tables due to privacy reasons (hint: there are workarounds for this problem!)
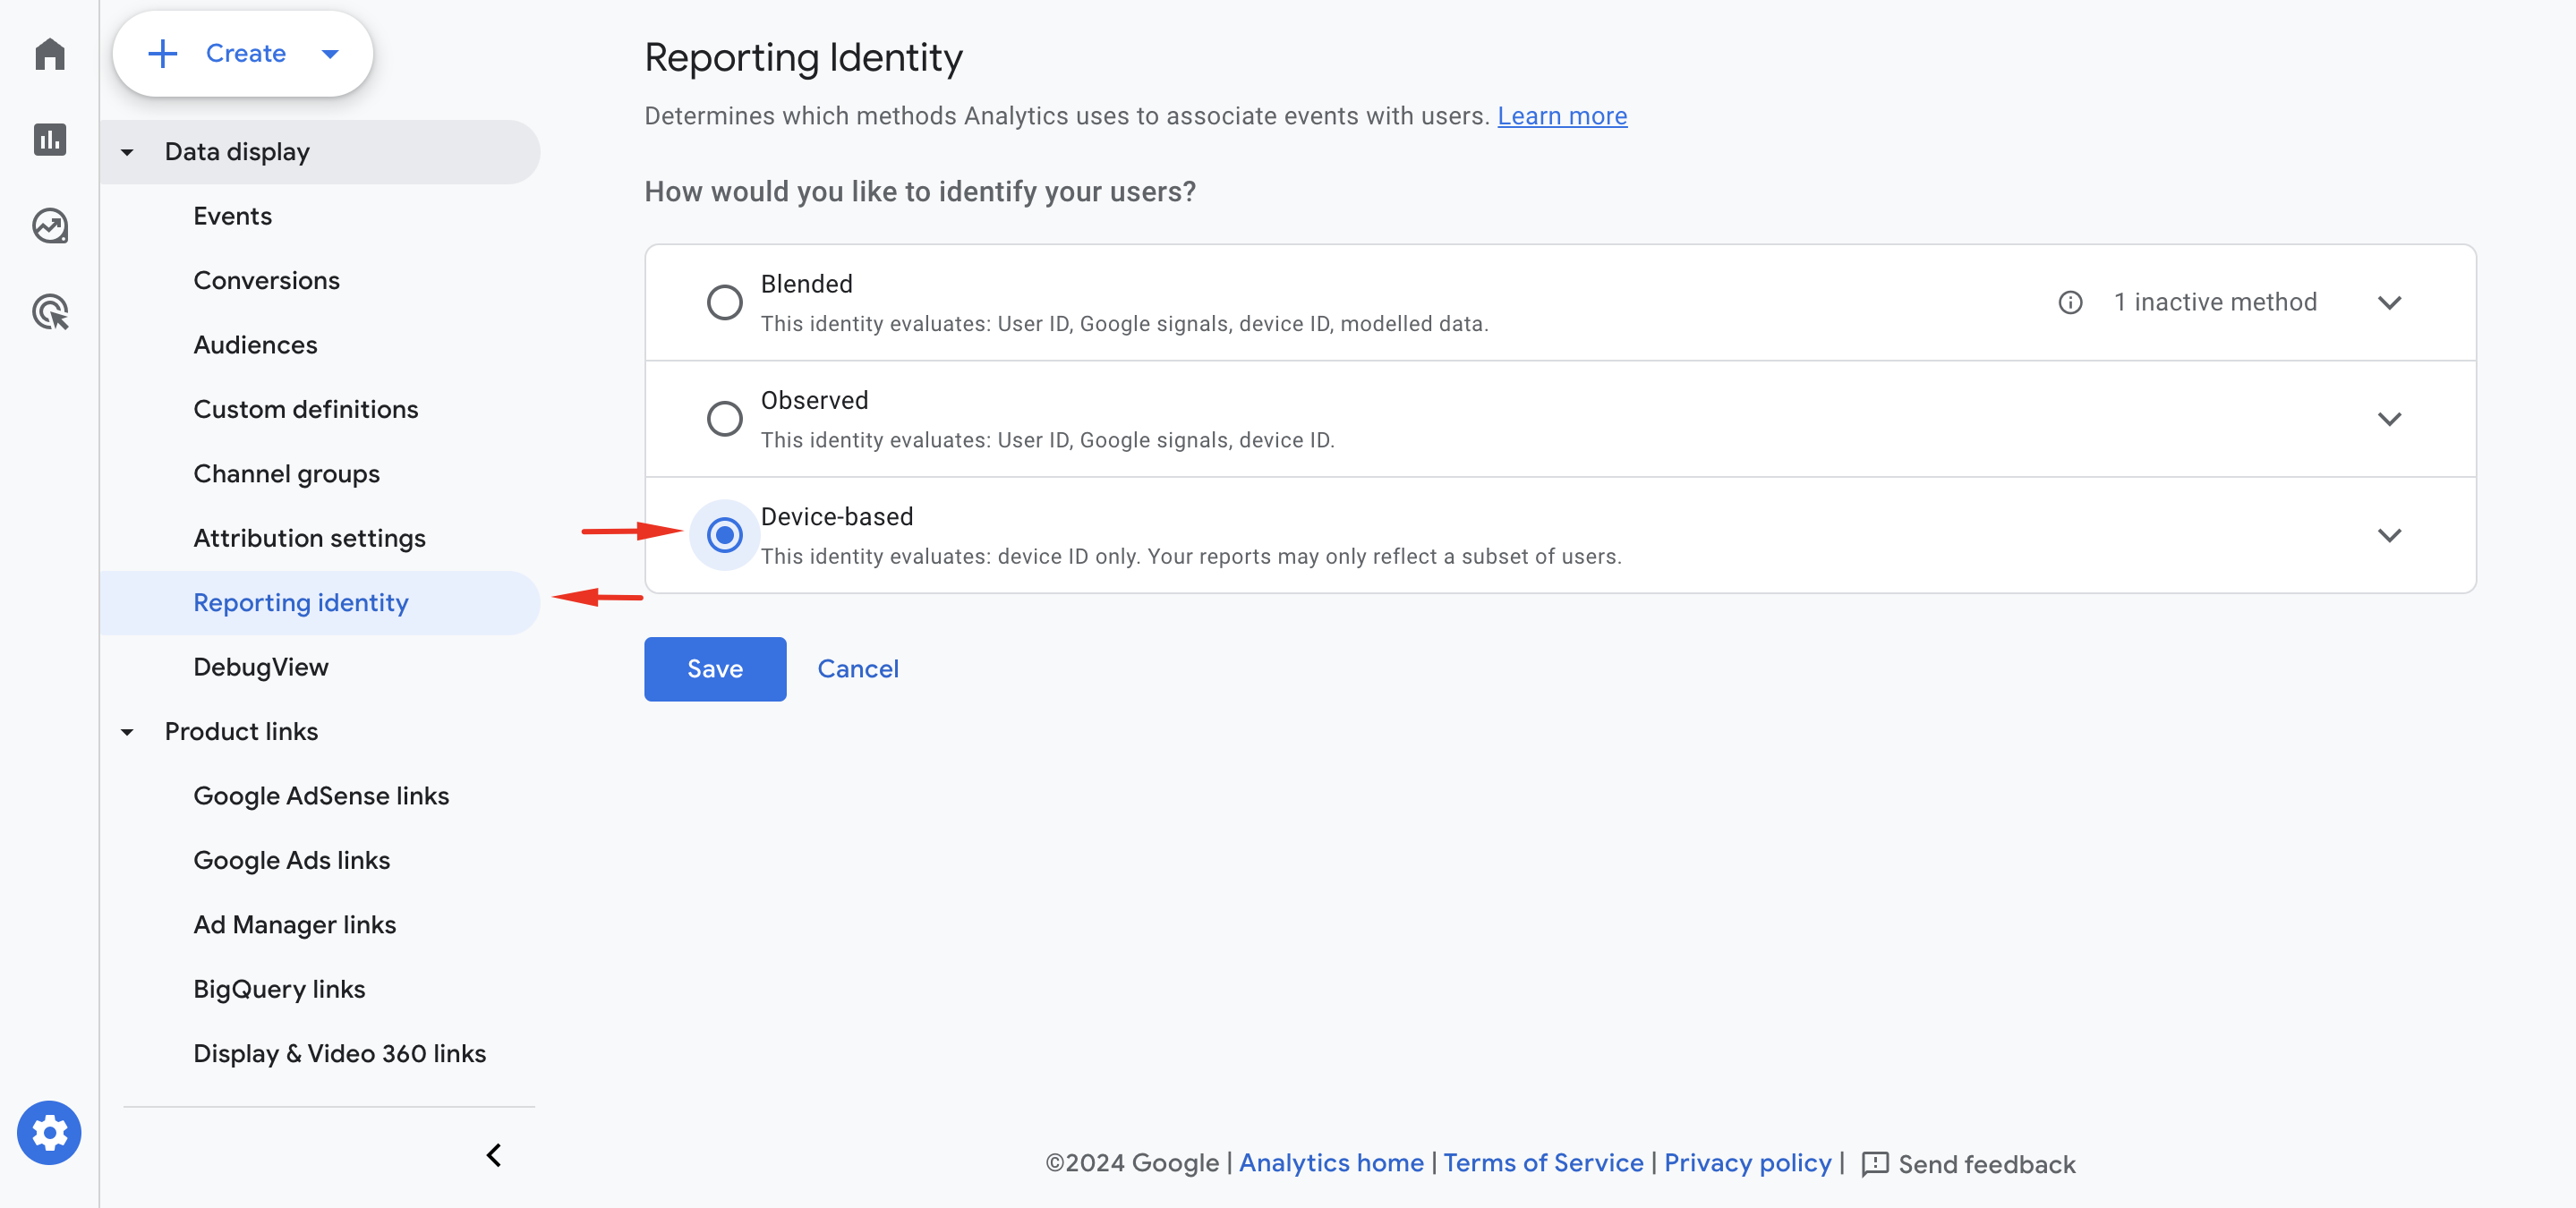
3. Switch the Reporting Identity to Device-based
In theory, this is supposed to be the reporting profile with the lowest accuracy (heck it's even hidden when you first open Reporting Identity in Admin panel - you need to click on the small print "Show All" in the left-bottom corner).
But in practice this reporting identity model enables you to see more accurate attribution - less Direct and Unassigned traffic .
One thing to note is that Reporting Identity affects reports ONLY - not the data itself, so the change here happens only 'on the surface'.
The different metrics in reports are visible instantly, and this change is reversible - so in case your attribution actually turn out worse, switch back to the default Reporting Identity (i.e. "Blended") with no side effects.
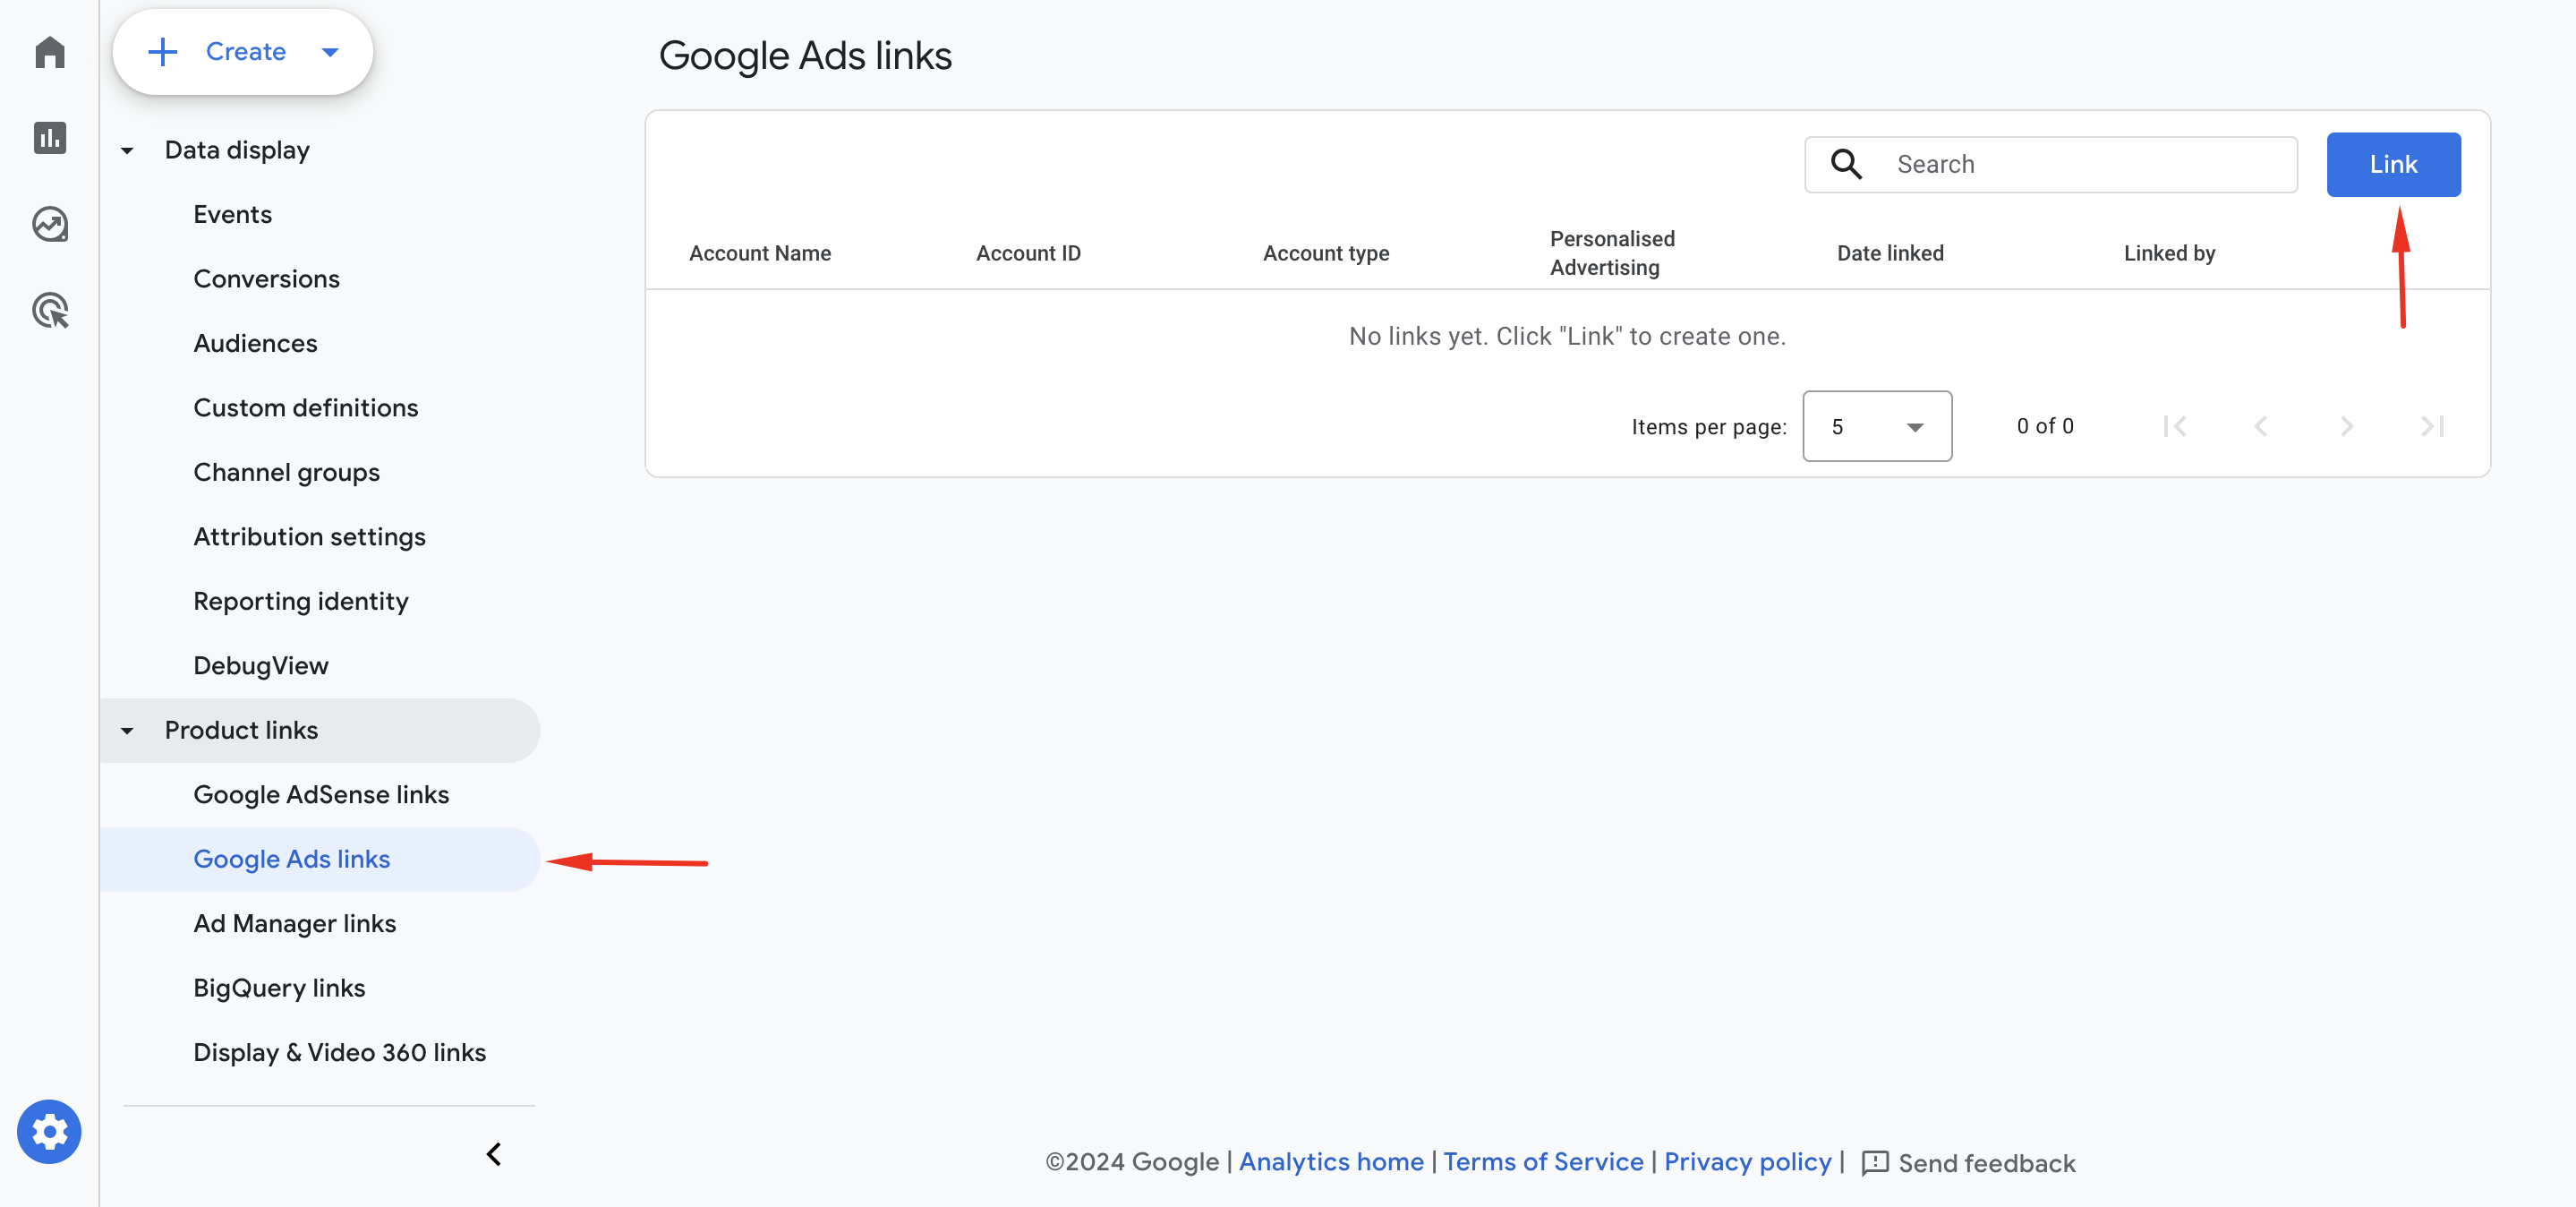
4. Link Google Ads account(s)
Linking Google Ads account to your GA4 property opens up the "gates" for Ad-specific data to flow into GA4 (Campaign names, Ad groups, Keywords, costs etc). Without it you won't be in position to create insightful reports about google/cpc traffic.
We will explain the creation of Google Ads Reports as the last (optional) step in this article.
You'll be able compare conversion numbers on GA4 vs Google Ads, troubleshoot potential inconsistencies, and achieve higher accuracy with ROAS metrics.
But the superpower of connecting Google Ads to GA4 is that it will allow you to share audiences with your Google Ads account to use in your remarketing campaigns. Please note that enabling Google Signals is a prerequisite for this functionality.
Actions in Week 1
5. Understand Additional (& Very Useful!) Custom Dimensions
In addition to the standard Enhanced Ecommerce parameters, Littledata sends very useful custom data with your events. For the full list check our tracking schema.
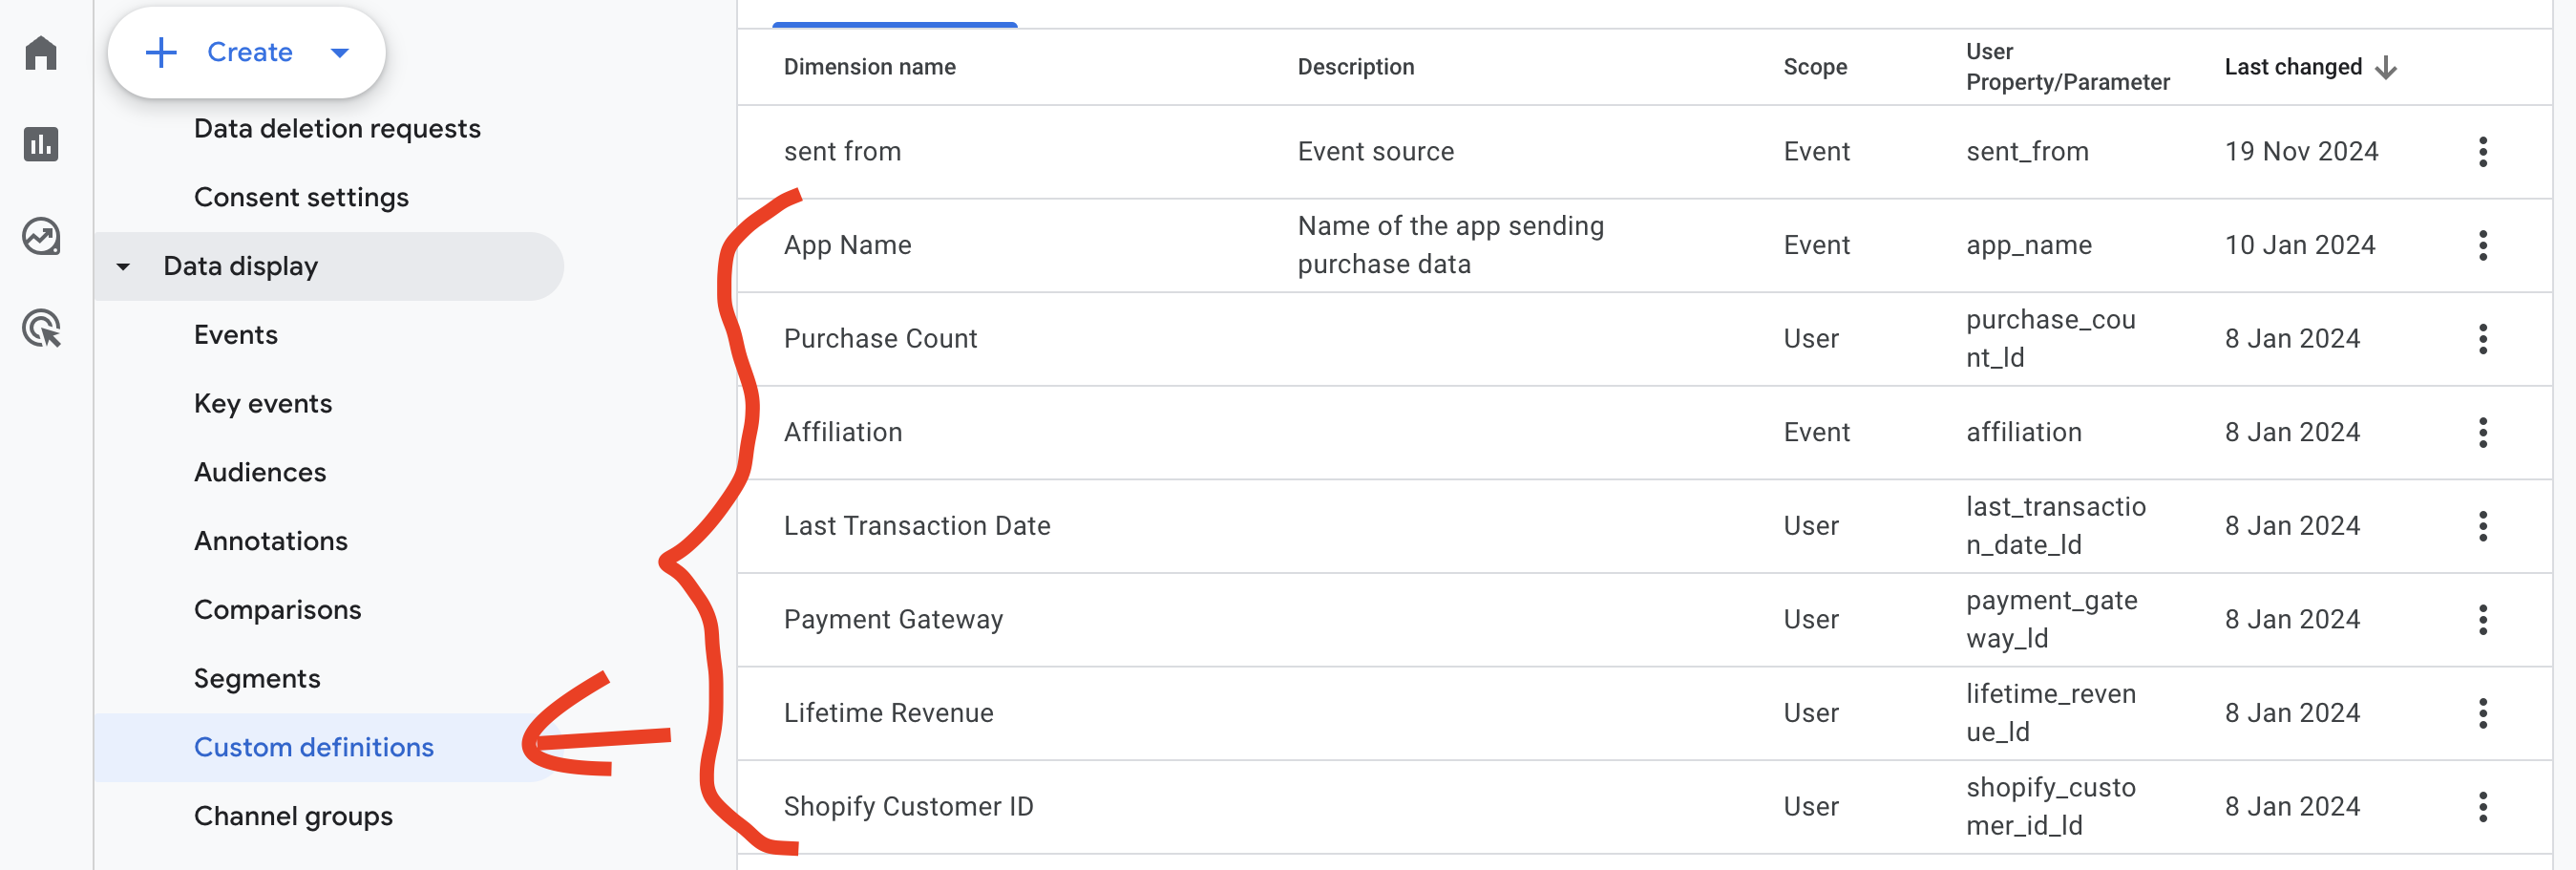
These user parameters are automatically registered as Custom Dimensions your GA4 account - and you can see them in "Custom definitions" section of GA4 Admin panel.
If you installed Littledata prior to Aug 10th 2023 you will need to MANUALLY register these parameters.
For example think about how useful could be the parameter called - affiliation - which maps the Shopify order tag(s) to the corresponding purchase making it easy to identify particular purchase sources.
For example:
- Subscription Recurring Order
- Subscription First Order
- Amazon Marketplace
- Draft Order
Since Littledata tracks ALL the purchases that happen on your store, it's extremely important to be able to separate Draft orders, Recurring orders (and others if applicable) so you can attribute your revenue properly.
E.g. excluding the Recurring order revenue gives clearer ROAS for brands who sell subscriptions.
Also having each customer tagged with the exact number of purchases they had - can trigger many GA4 udience ideas.
6. Place GA4 Measurement ID on subdomains
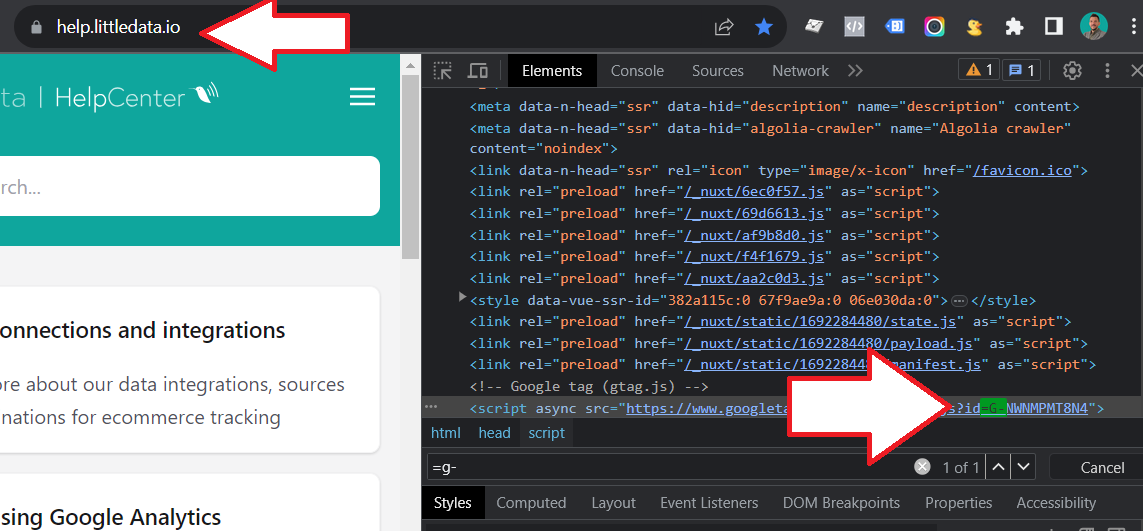
If you're using non-Shopify landing pages in your advertising funnel it's likely they are on a different subdomain. Make sure to install GA4 tracking on ALL subdomains - in most cases a simple "vanilla" GA4 configuration installed via GTM would do the job.
Doing this will preserve the GA4 attribution for the channels that actually produced conversions on your main website:
Actions in Week 2
7. Create Audiences
Create a GA4 Audiences based on Littledata-specific custom dimensions - e.g User Lifetime Value, User Purchase Count, User Last Transaction Date etc.
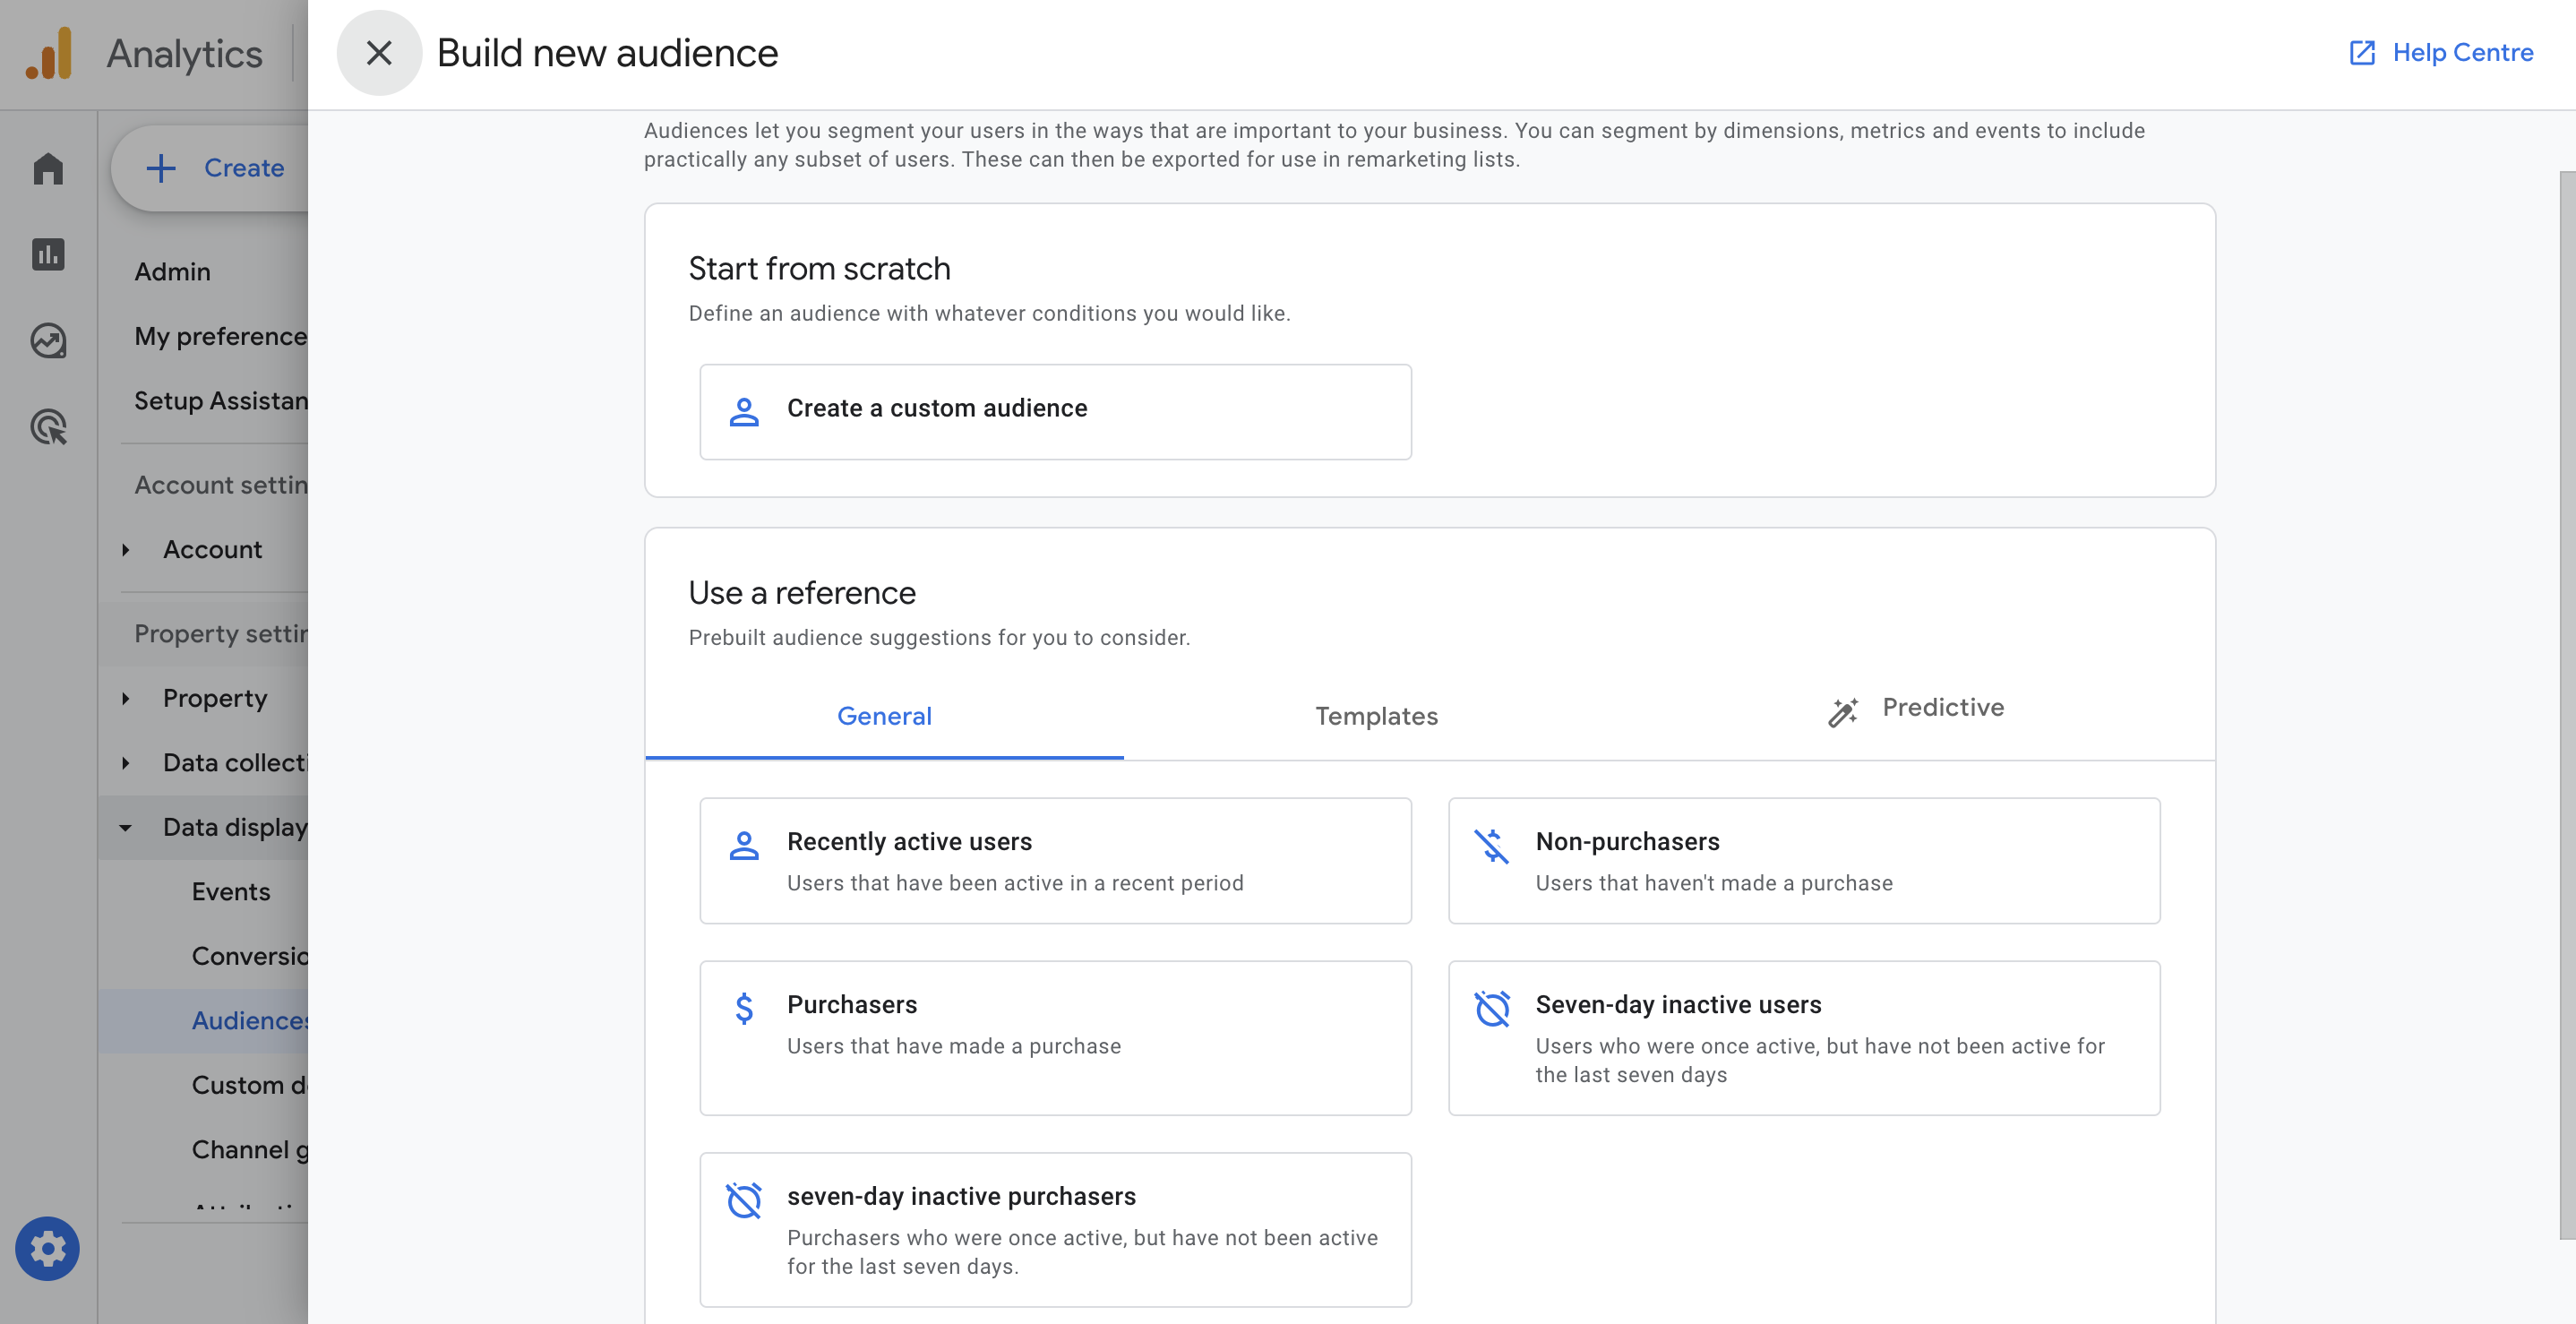
After clicking on "Audiences" in the Admin panel, you'll be prompted to choose between custom audiences and several GA4 templates. We strongly encourage you to test different options and see what best suits your business needs:
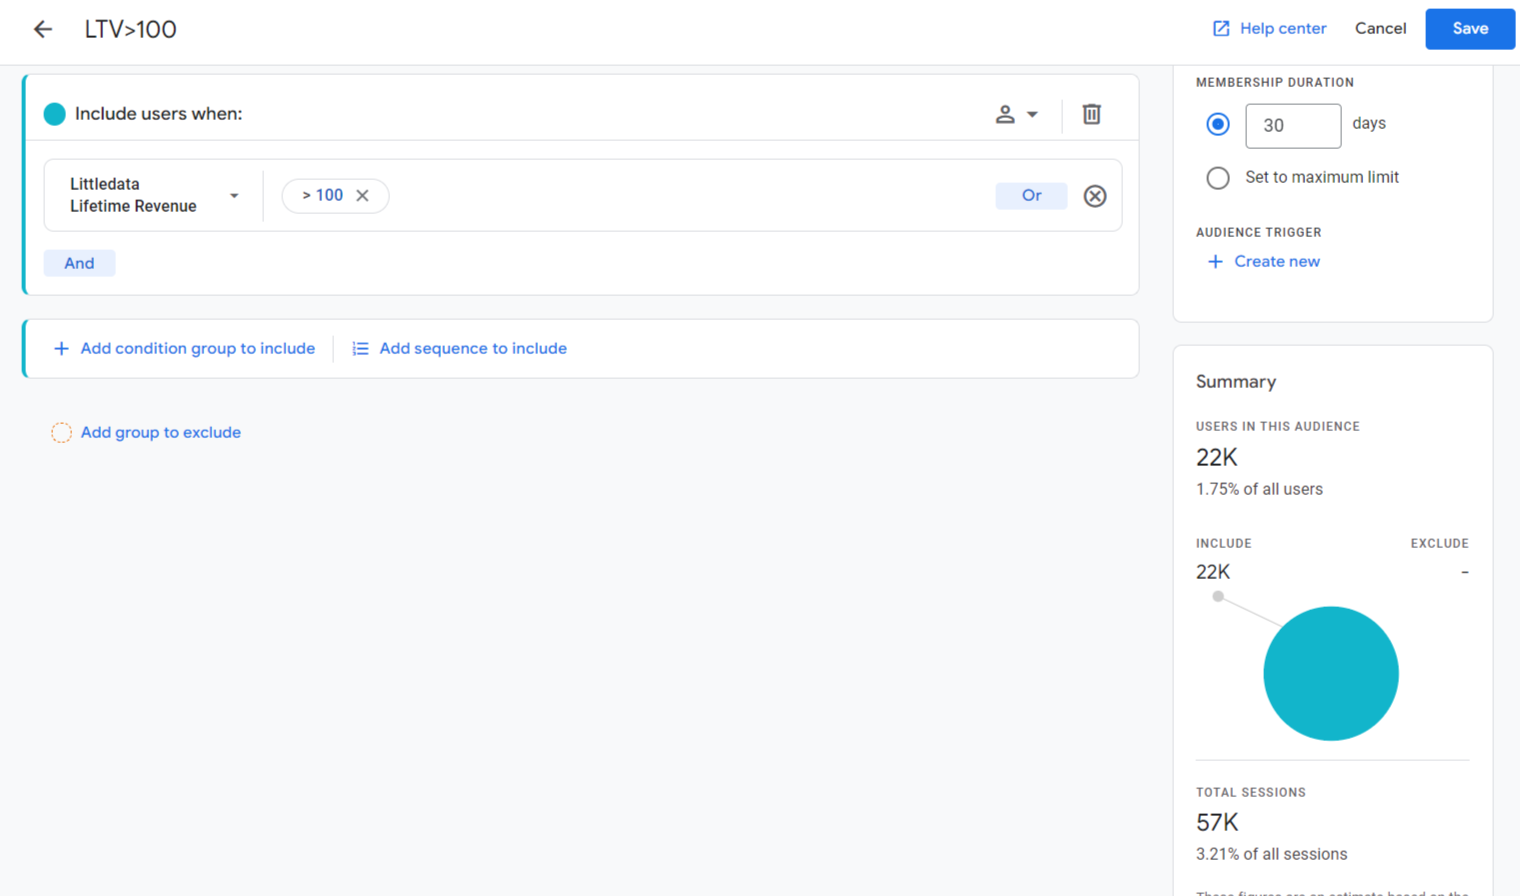
In the Audience setup panel, find dimension you wish in the left-hand side dropdown and set a threshold (e.g. User has a Lifetime Value of more than $100).
Note that the right hand panel estimates the size of the audience BUT it's not representing the number you'll initially have in the audience because it takes up to 72 hours for them to populate, and you can not analyze behavior retroactively.
8. Create a Custom Channel Grouping
GA4 default channel grouping creates a lot of confusion as it, more often than we'd like, misrepresents legitimate source/medium combination as unassigned traffic.
Here's the sage advice of how fellow marketer/experts go through session source/medium traffic report and check if there's a custom source/medium combination e.g. fbig/pay_soc which would unfortunately fall into unassigned even if it's obvious that stands for Facebook / Instagram advertising.
9. Create Custom Reports: First User source/medium report
If you've been using Universal Analytics you'd know that Acquisition > Source/Medium was practically the homepage of Google Analytics for a long time. That's why we decided to use recreation of that one as an example how to customize a standard report and make it accessible in the left-hand side menu to all the GA4 property users.
In case you know this and want something more valuable here's probably the most useful yet hidden gem GA4 report available to any ecommerce out there (especially to those with Littledata installed!)
First please check your access as you'll need 'Editor' level in order to do this:
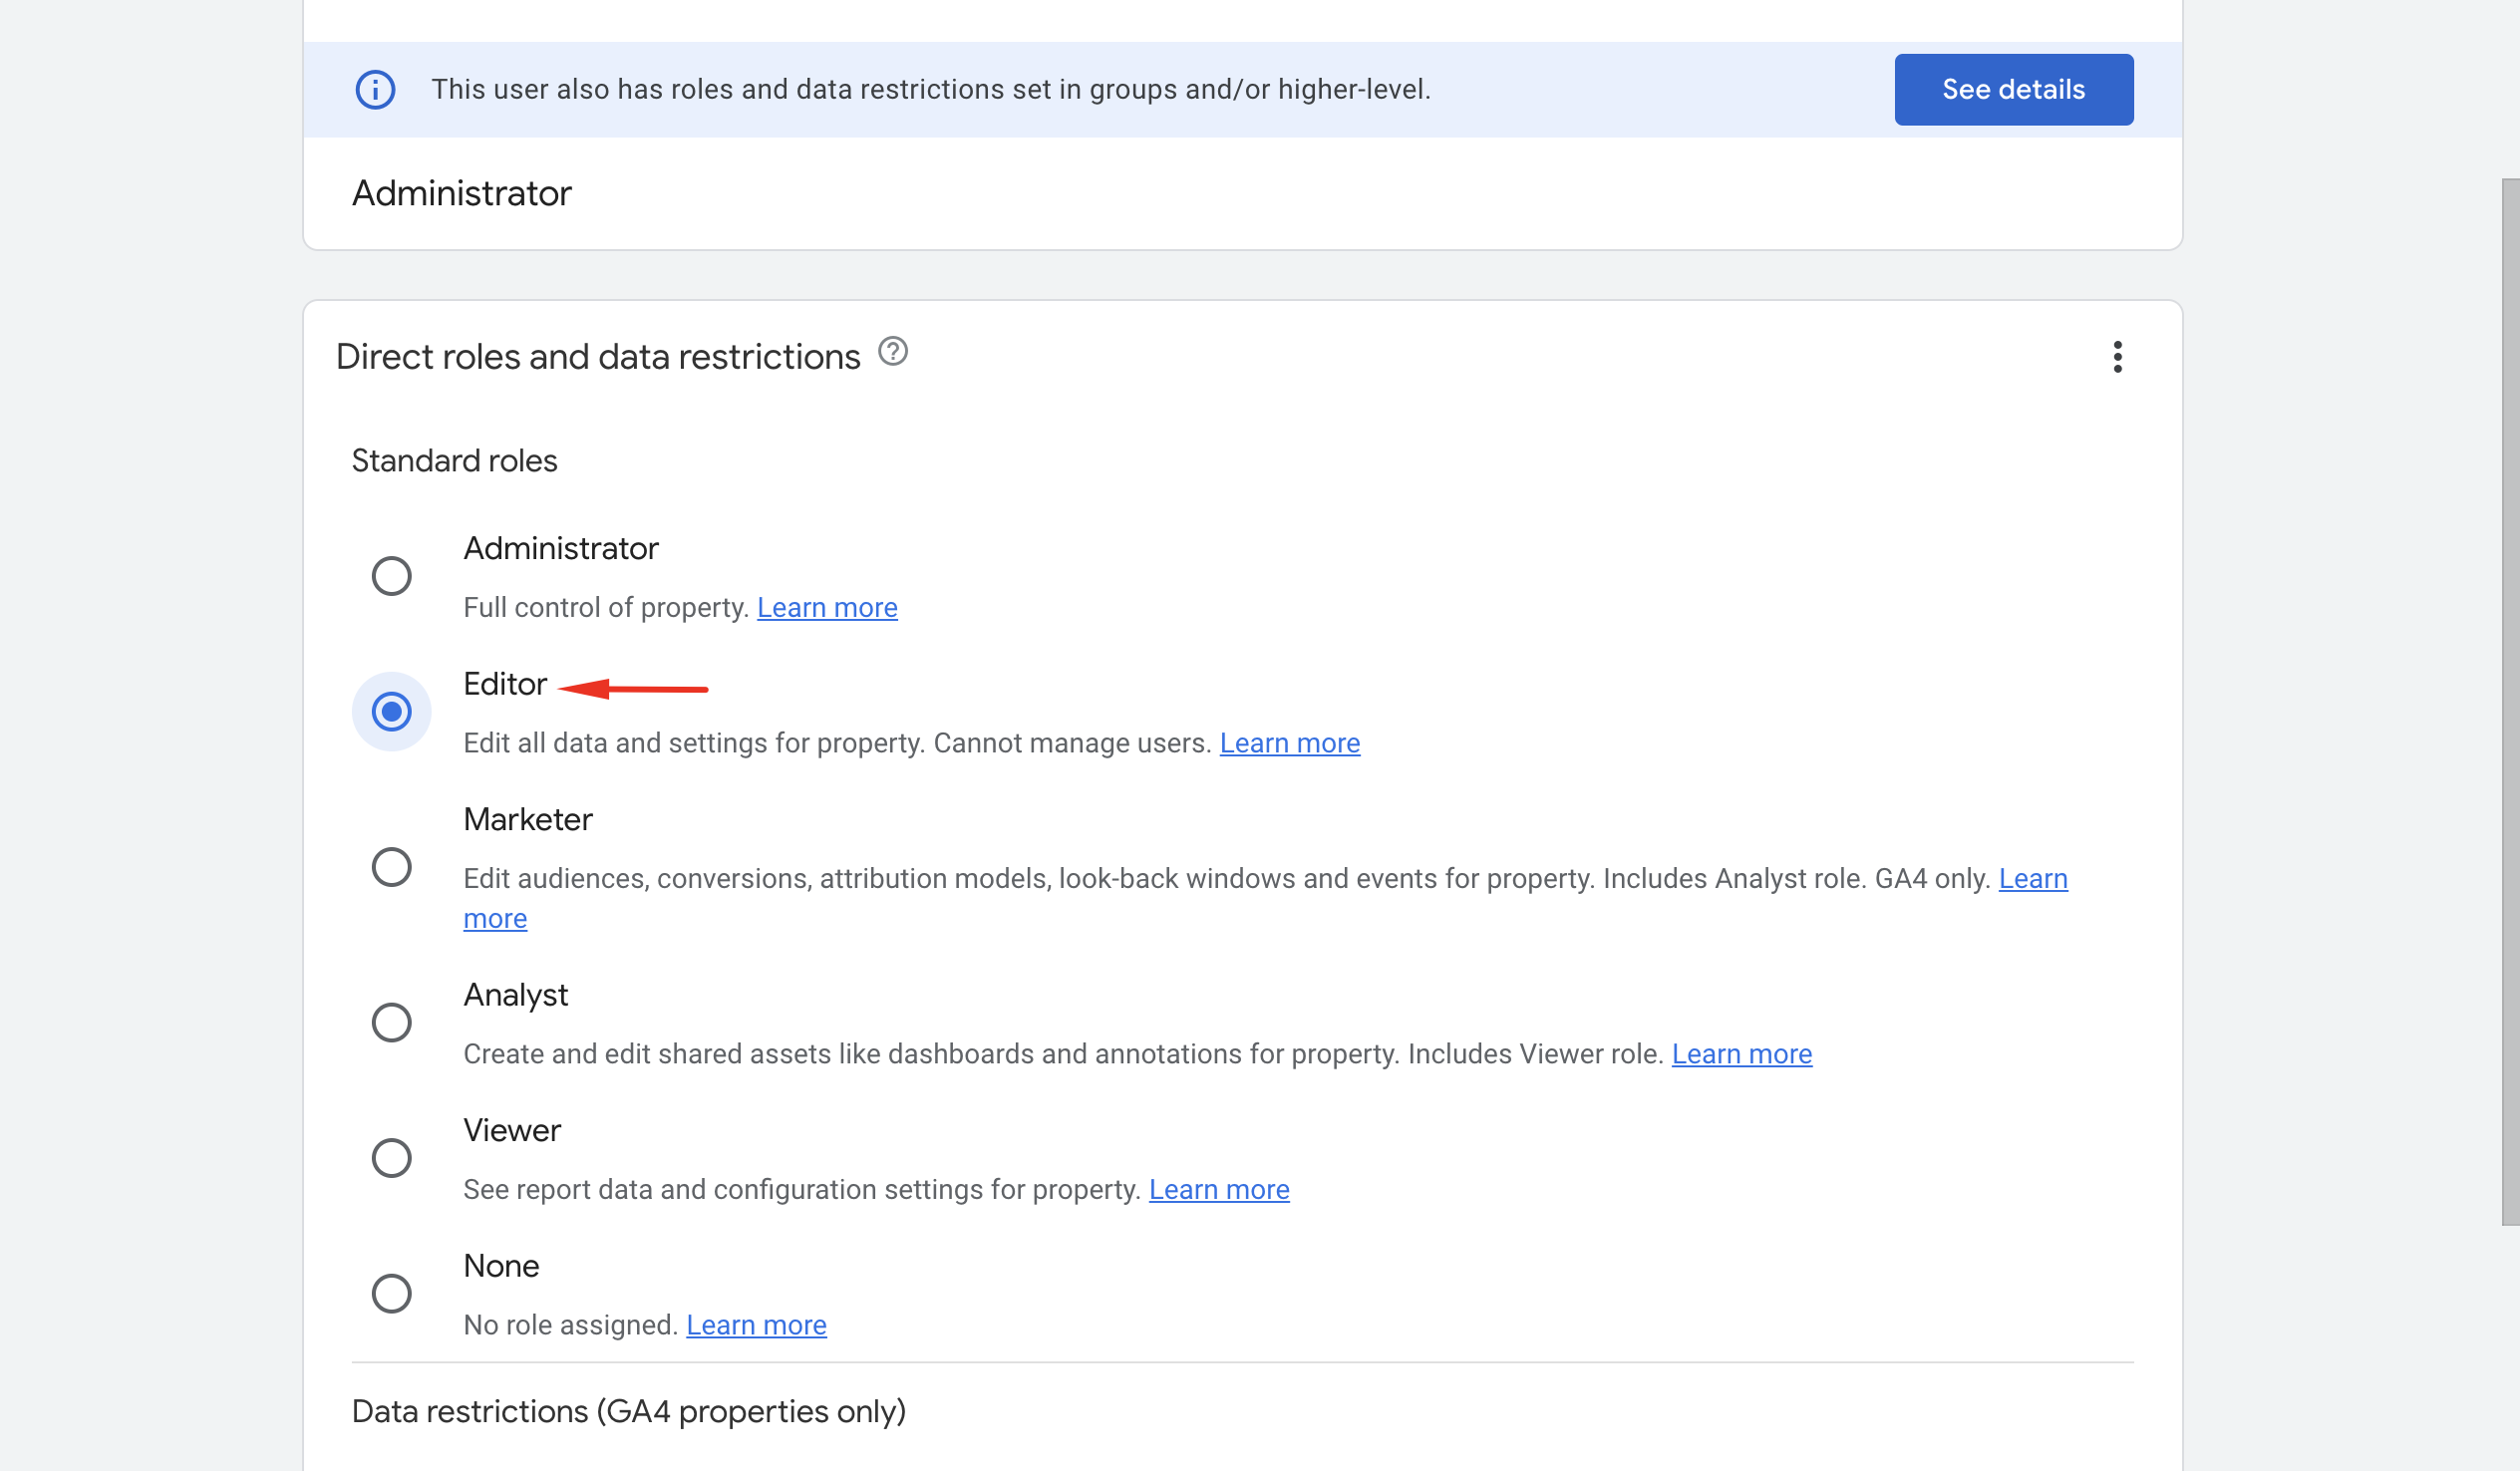
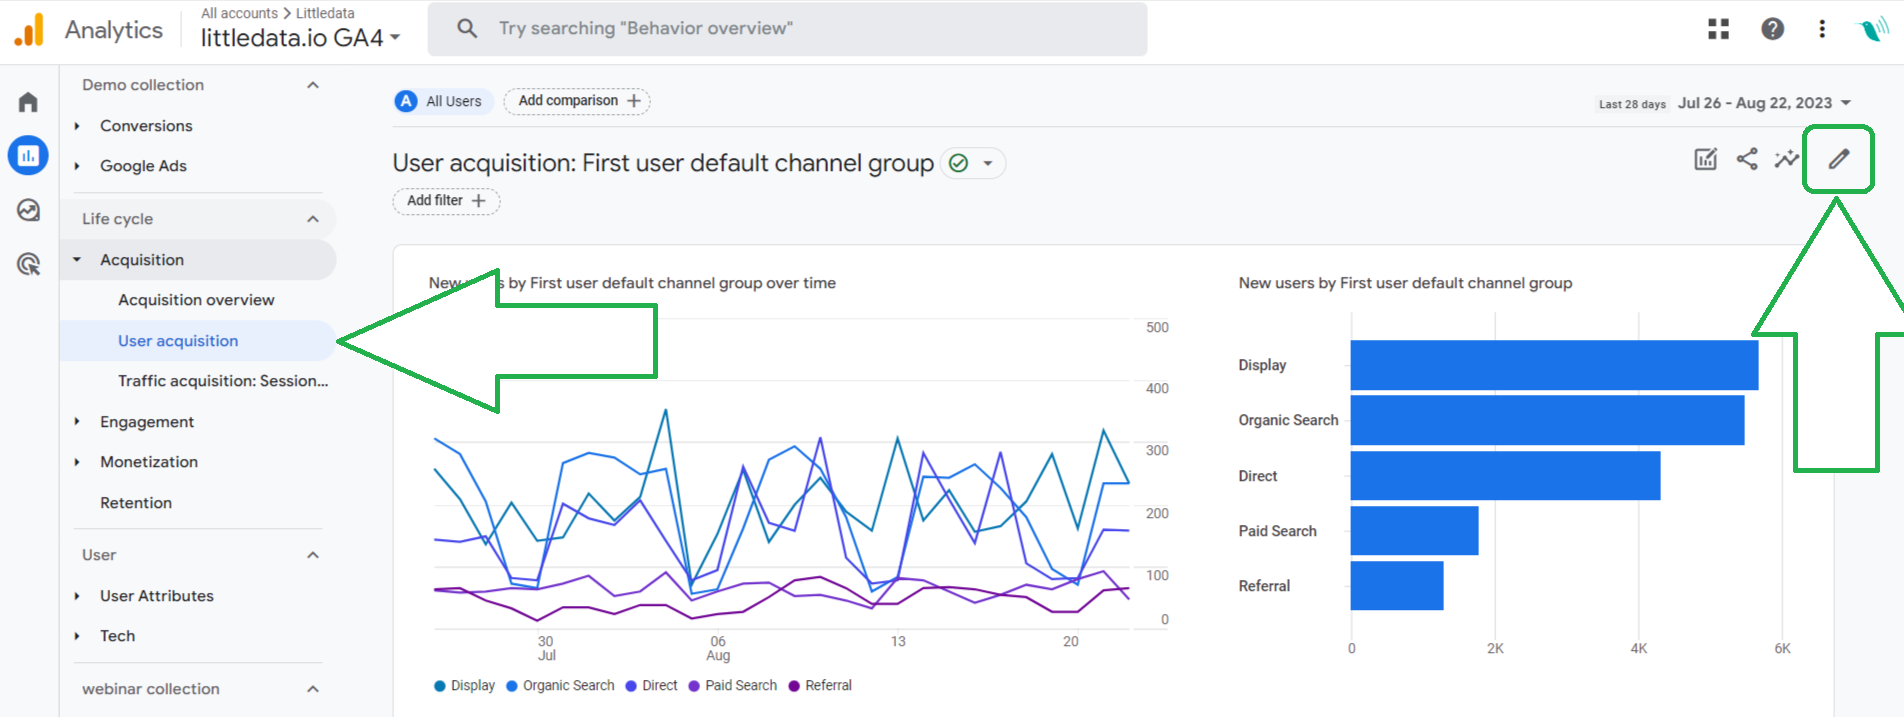
How do you know if you have the proper access level? Open the First User source/medium report in the Acquisition Topic of Life Cycle Collection, and look for the icon pencil in the top-right corner, right under your google profile photo.
If you see the pencil - your access level is good, so go ahead and click on it!
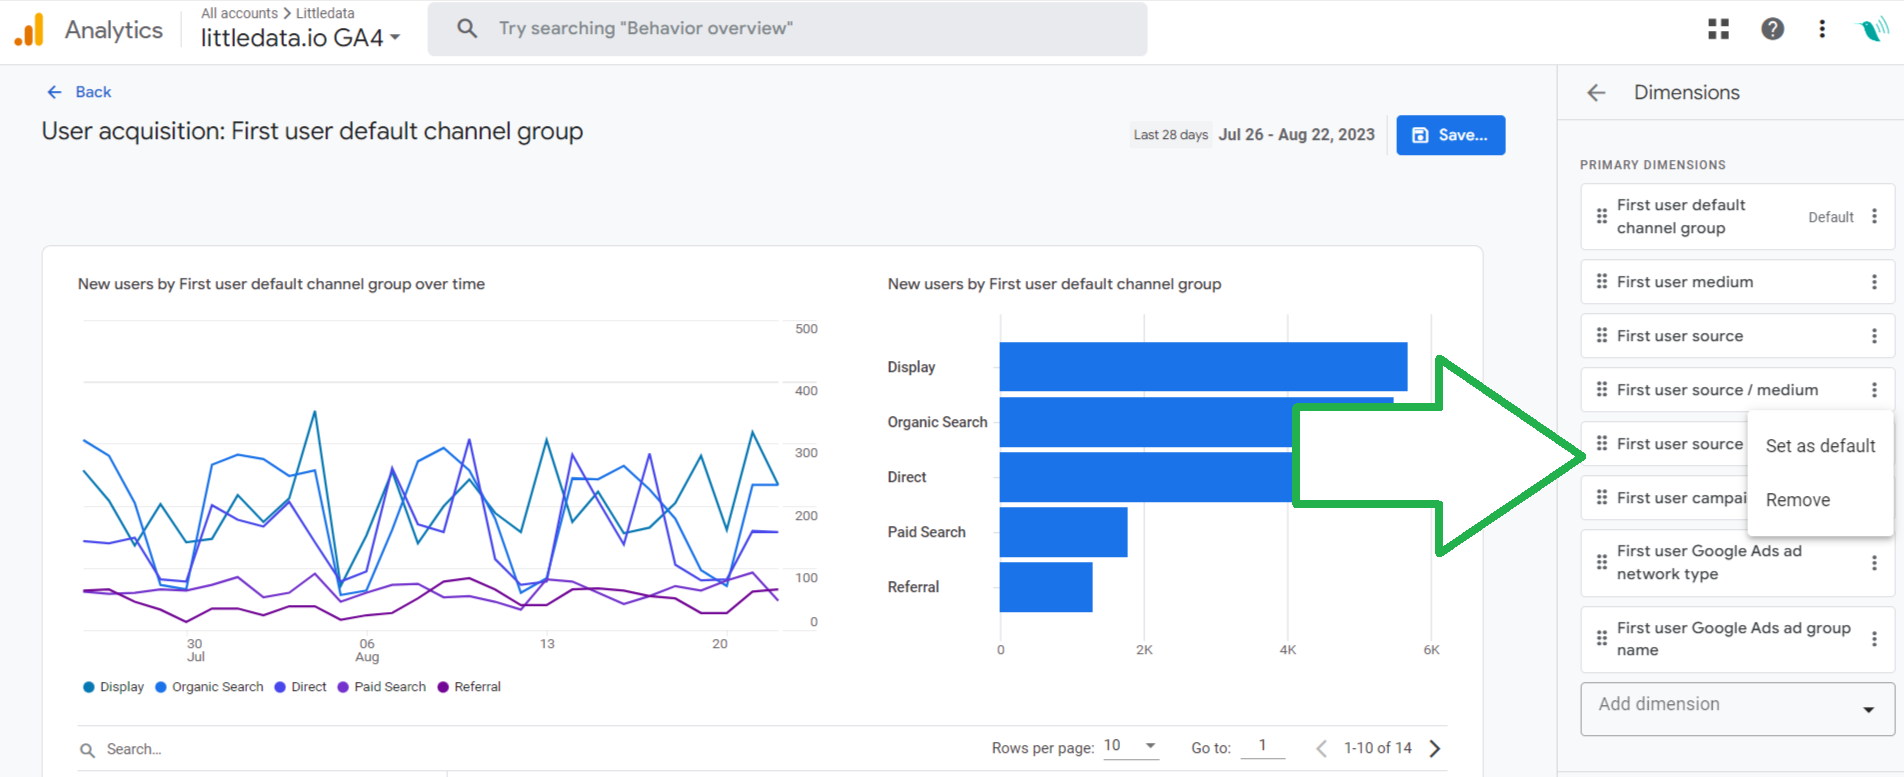
Once the "Customize Report" menu appears, click on the 'Dimensions' box, and select "first User Source/Medium" as the default dimension, by clicking on three dots and choosing the proper option from the popup:
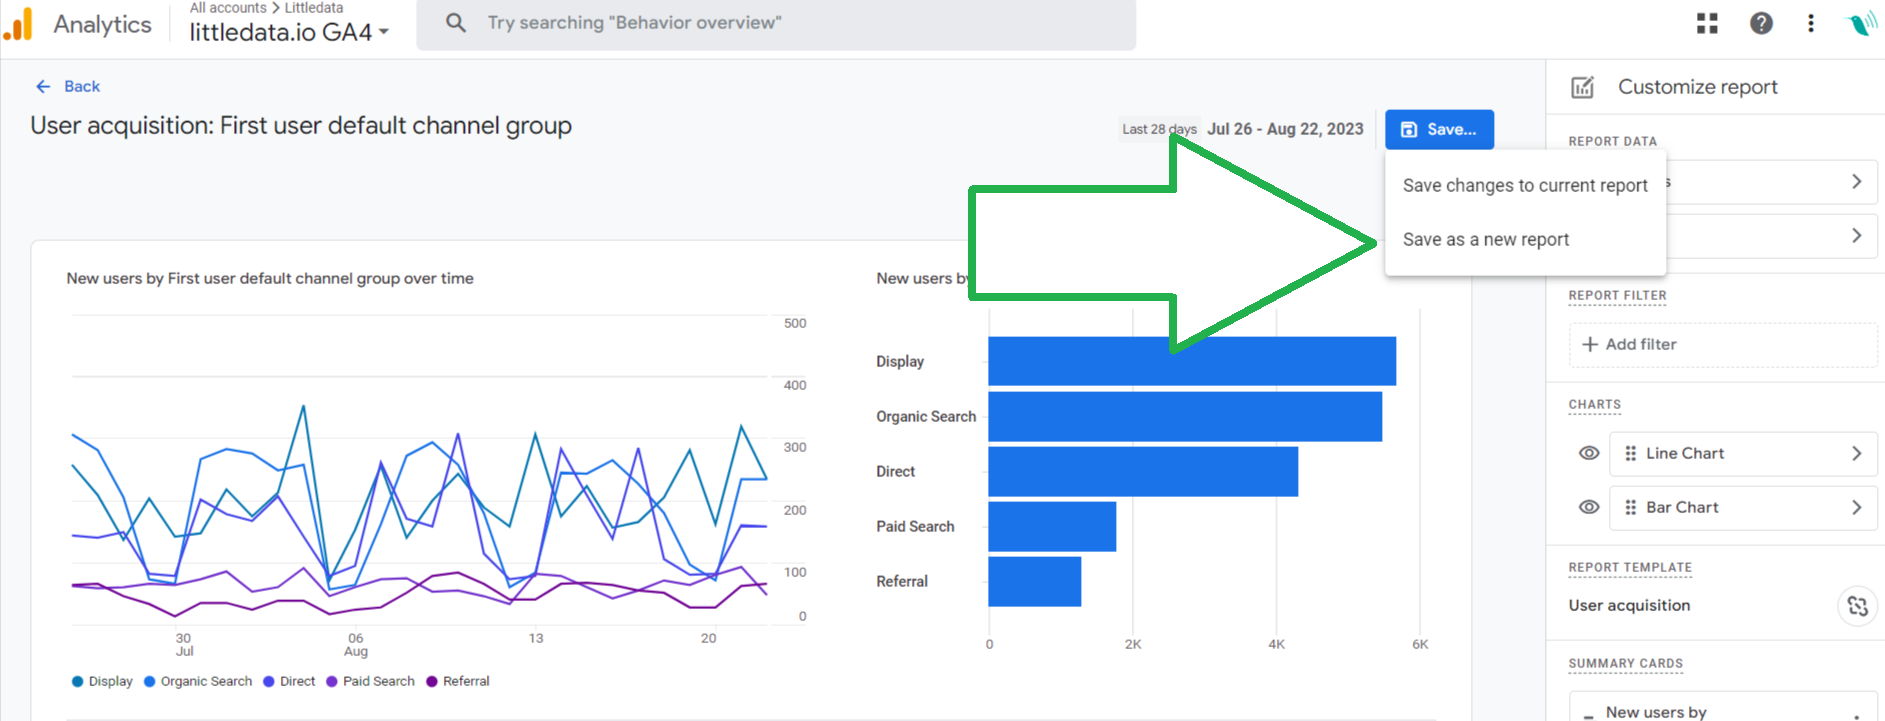
After clicking Apply on the Customize menu bottom-right corner, make sure to Save the report as a new one. Give it a descriptive name e.g. "1st User Source/Medium"
Now the only thing that's left is to include it in a standard reporting section.
So if you click Back arrow on the top-left corner, you should be in the standard UI again.
Now: (1) Click the Reports section and (2) you'll see "Library" link at the very bottom - click on it!
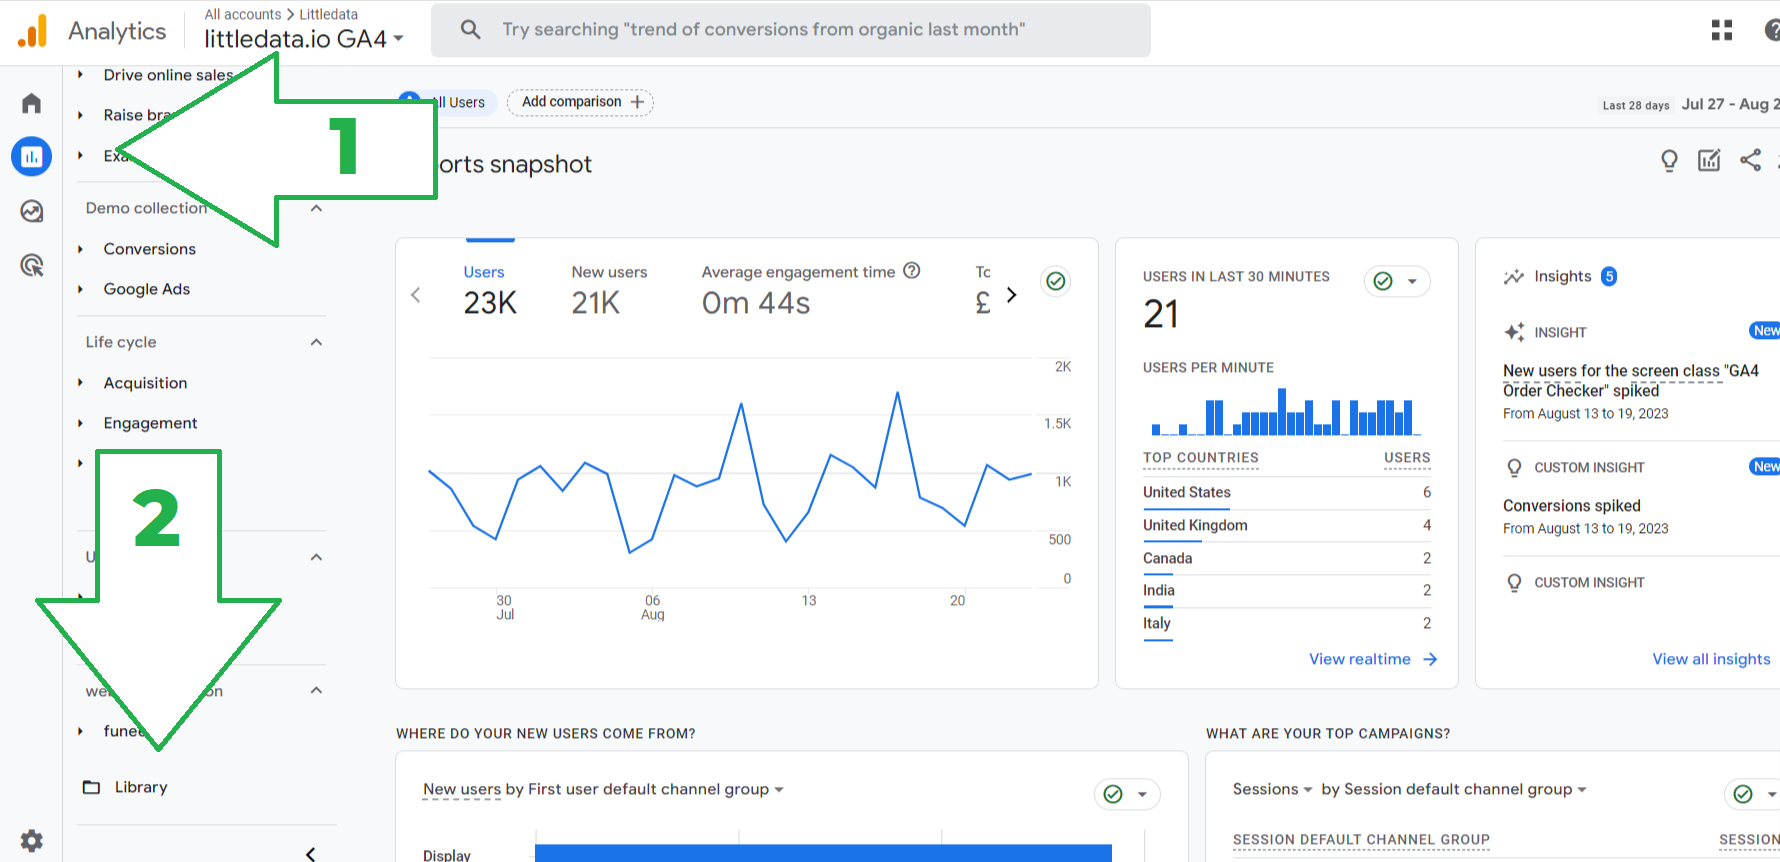
For the sake of simplicity we're gonna stick with Editing an existing collection - e.g. Life Cycle
When you click on "edit collection" you'll find yourself in the menu like the one below - now please search/find the report "1st User Source/Medium" you saved, and drag/drop it to the collection!
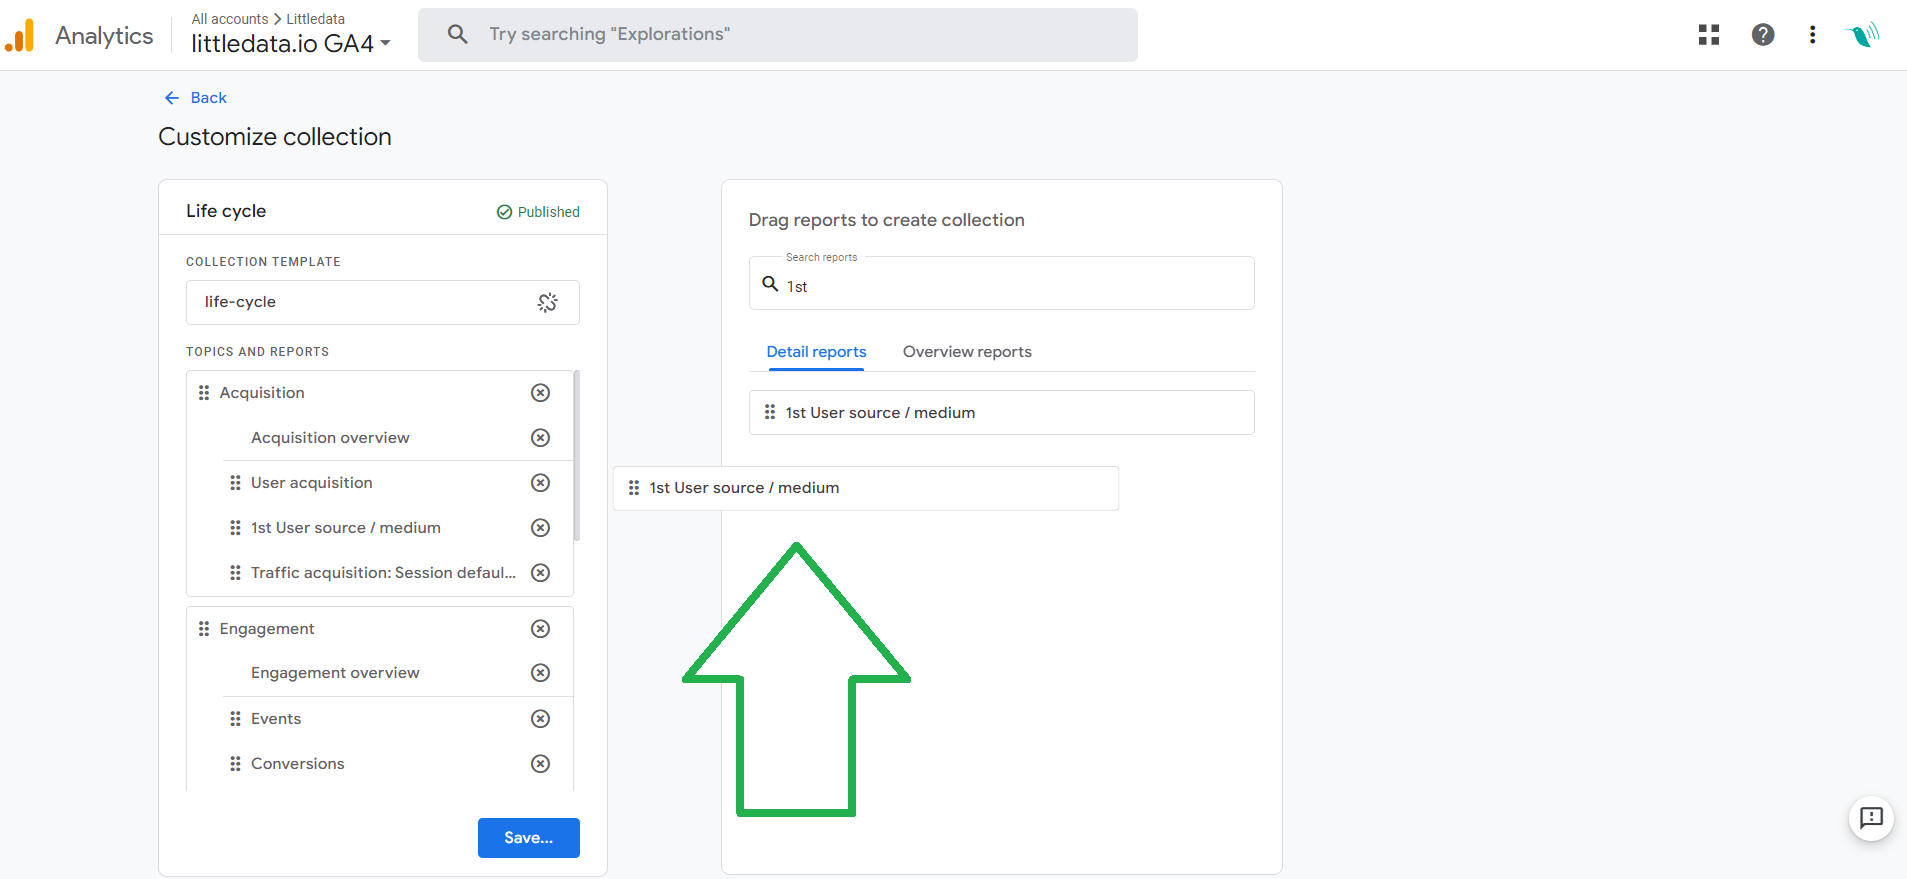
10. Create Custom Reports: Google Ads Report
If you are a long-time Google Analytics user, grown up on the mantra that GA is here to help people who spend money on Google AdWords, to better understand where their $$$ went - forget about it! New user interface in GA4 is everything but friendly towards the brands that advertise via Google Ads.
In the following chapter we'll teach you how to create Google Ads reports and include them in standard reporting interface.
First of all you're gonna have to open Acquisition section in the Life-Cycle collection and click on (1) Acquisition Overview. Once it's open, scroll down to the second row of cards and click "View Google Ads campaigns"
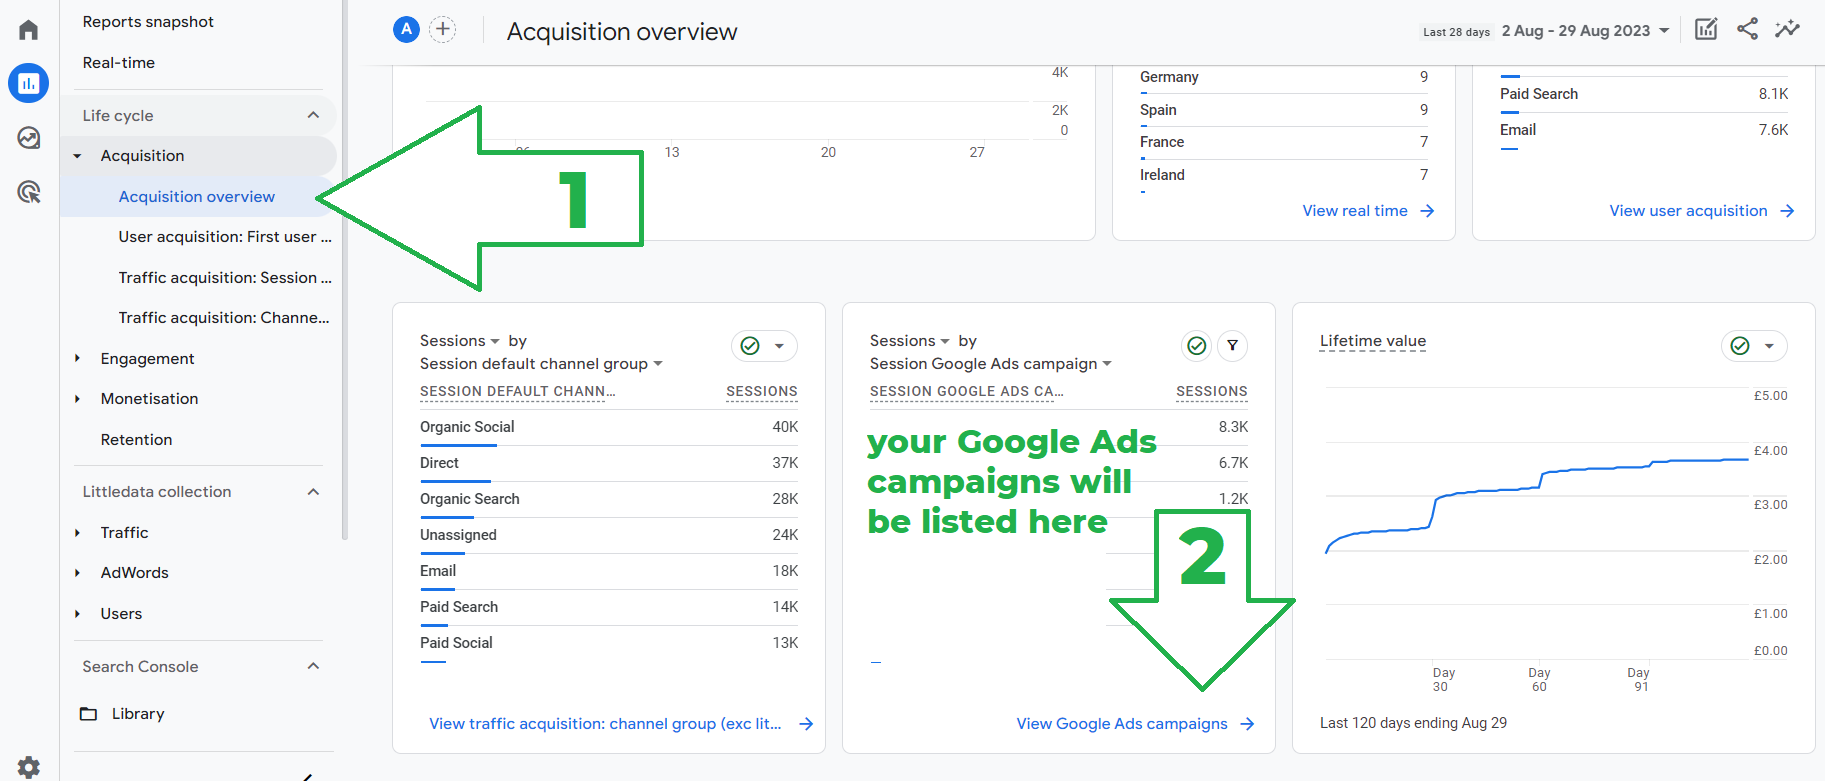
In upper-right corner of the report that opens up, you'll find the pencil icon for "Customize report". Click it and it will open a menu to add/remove metrics and dimensions including the most popular Google Ads data:
- keywords
- queries
- Total cost
- ROAS
- CPC etc
Notice that the line chart and bar graph at the top of the report reflect the dimension and metric pair that has been chosen as default and sorting respectively. So if you change for example default dimension to be Query and sort table by Conversions, here's how your upper report will look like:
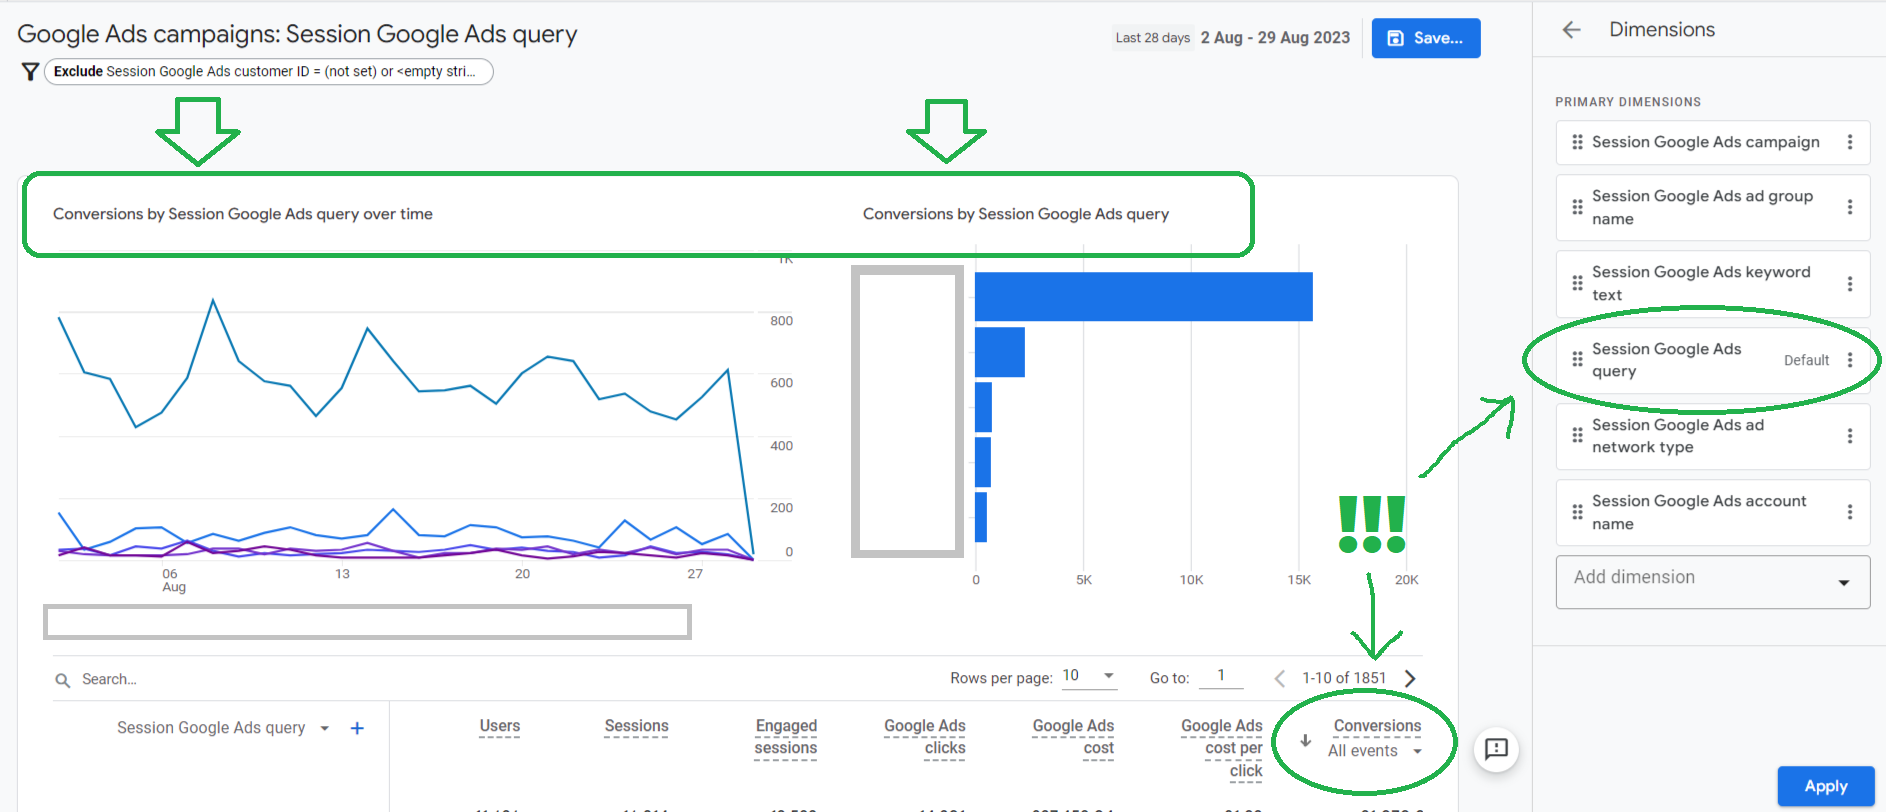
After clicking Apply on the Customize menu bottom-right corner, make sure to Save the report as a new one.
Now click on the Back arrow on the top-left corner, and once you're in the standard UI again. click the Reports section and then the "Library" link at the very bottom. To include the report in any of the standard collections follow the procedure described in the chapter "First User source/medium report"
11. Create Custom Reports: Refunds By Campaign Report
Another very useful feature of Littledata is that Refunds are automatically pushed back into GA4. What's even cooler is that you can trace refunds back to the channels that were attributed these purchases that eventually got refunded.
But simply adding "refunds" as a metric in the standard Ecommerce report in Monetization section simply doesn't work, for some reason (khm khm welcome to GA4).
So we'll show you another GA4 trick that is useful not only in this situation - while in the Ecommerce Purchases report (1) click on the Edit comparisons (2) in the uper right corner menu, and then Explore (3) in the bottom. This is the way to turn ANY standard report into a GA4 Exploration:
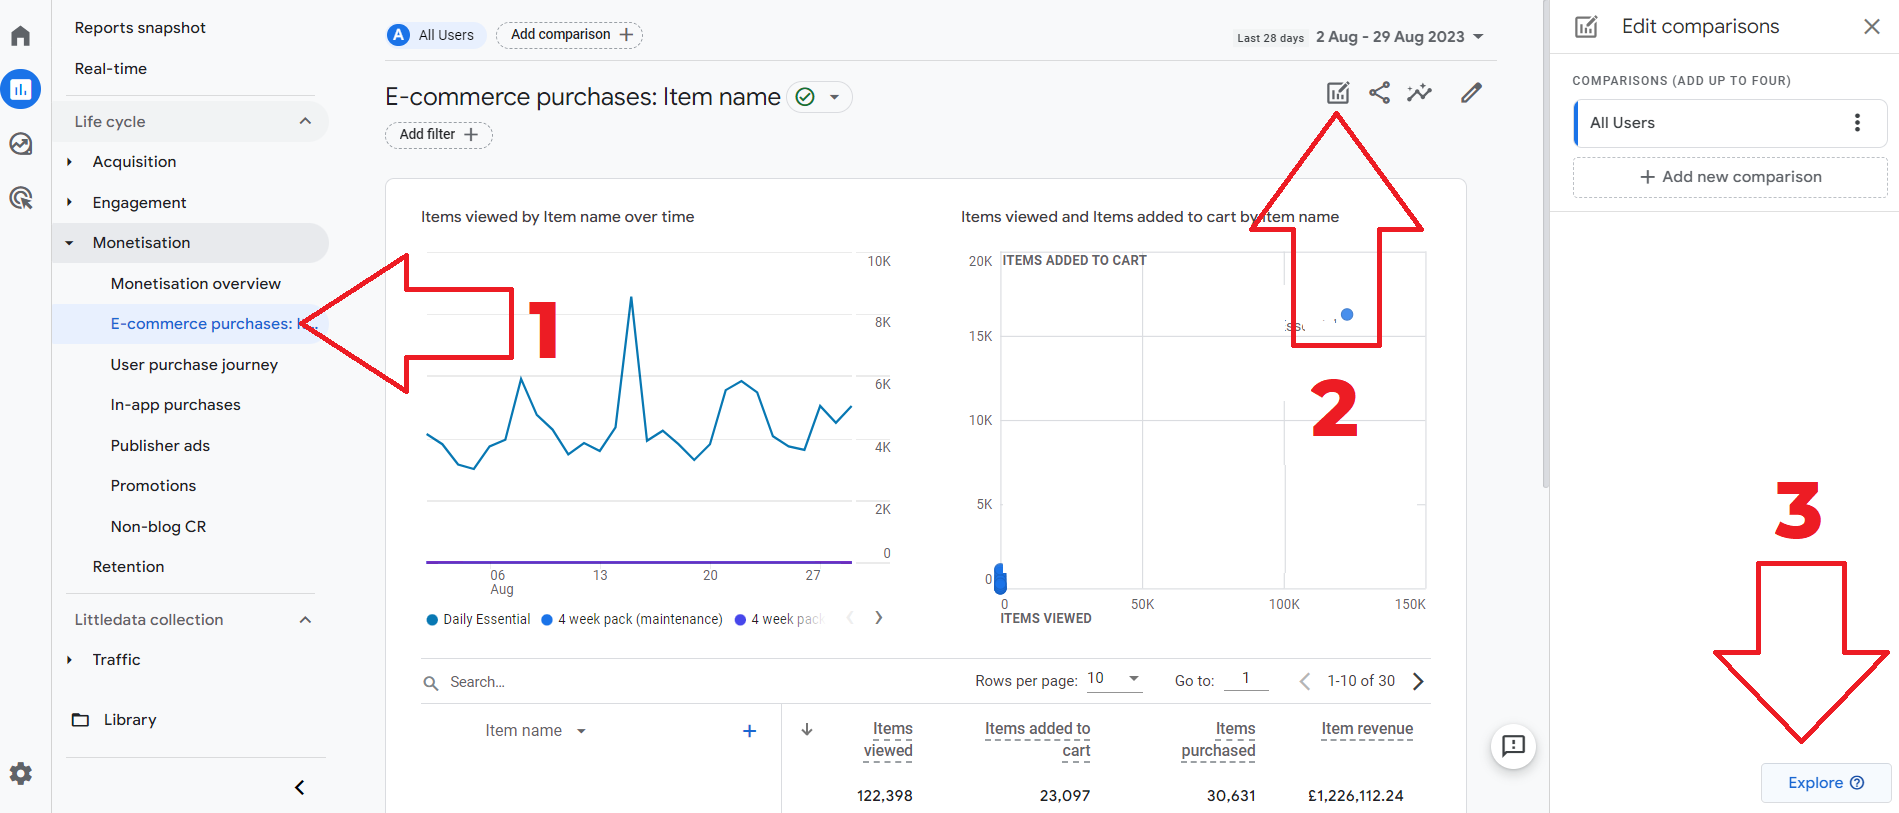
Needless to say, explorations in GA4 offer way more possibilities for slicing & dicing the data.
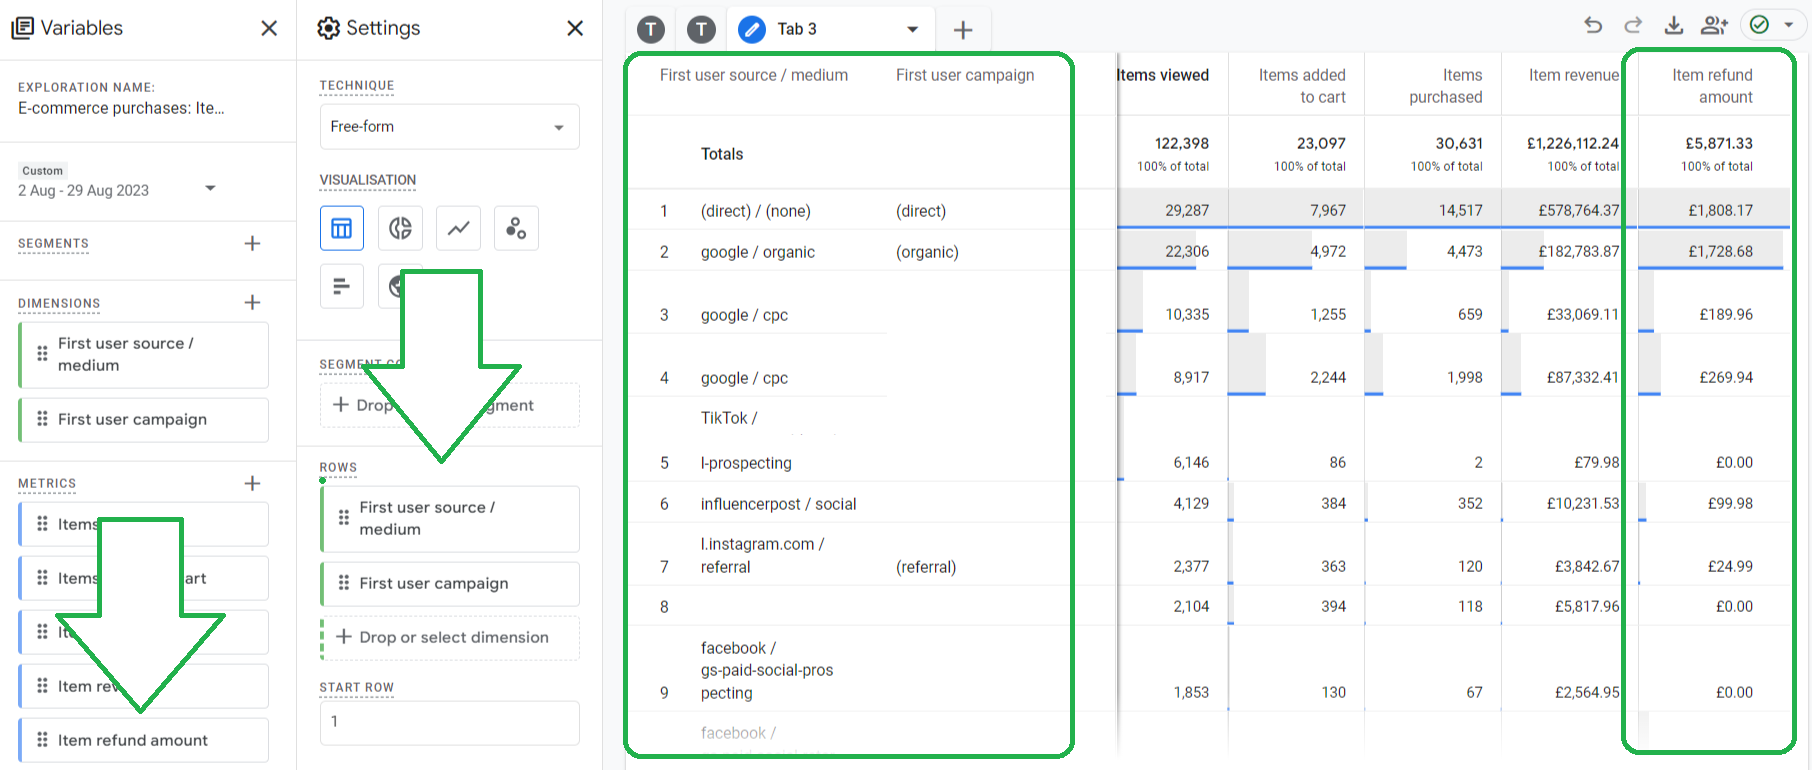
In this case we added Items_refunded_amount as an additional metric, and also First user source/medium and campaign as dimensions, so we can better understand channels' performance with refunds taken into account:
Conclusion
As beta as GA4 may seem for an inexperienced user - once you combine it with powerful data source like Littledata and add some practitioners trickery, it gives you way more power than any other tool out there for understanding your ROAS and overall website performance!
Happy analyzing!