How To Calculate ROAS In GA4
Google Analytics 4 (GA4) does not provide Return on Ad Spend (ROAS) as a built-in metric. For reasons unknown, GA4 product managers have not made it easy for advertisers to surface this crucial metric. However, there is a straightforward workaround that allows you to calculate ROAS in GA4 and display it in reports.
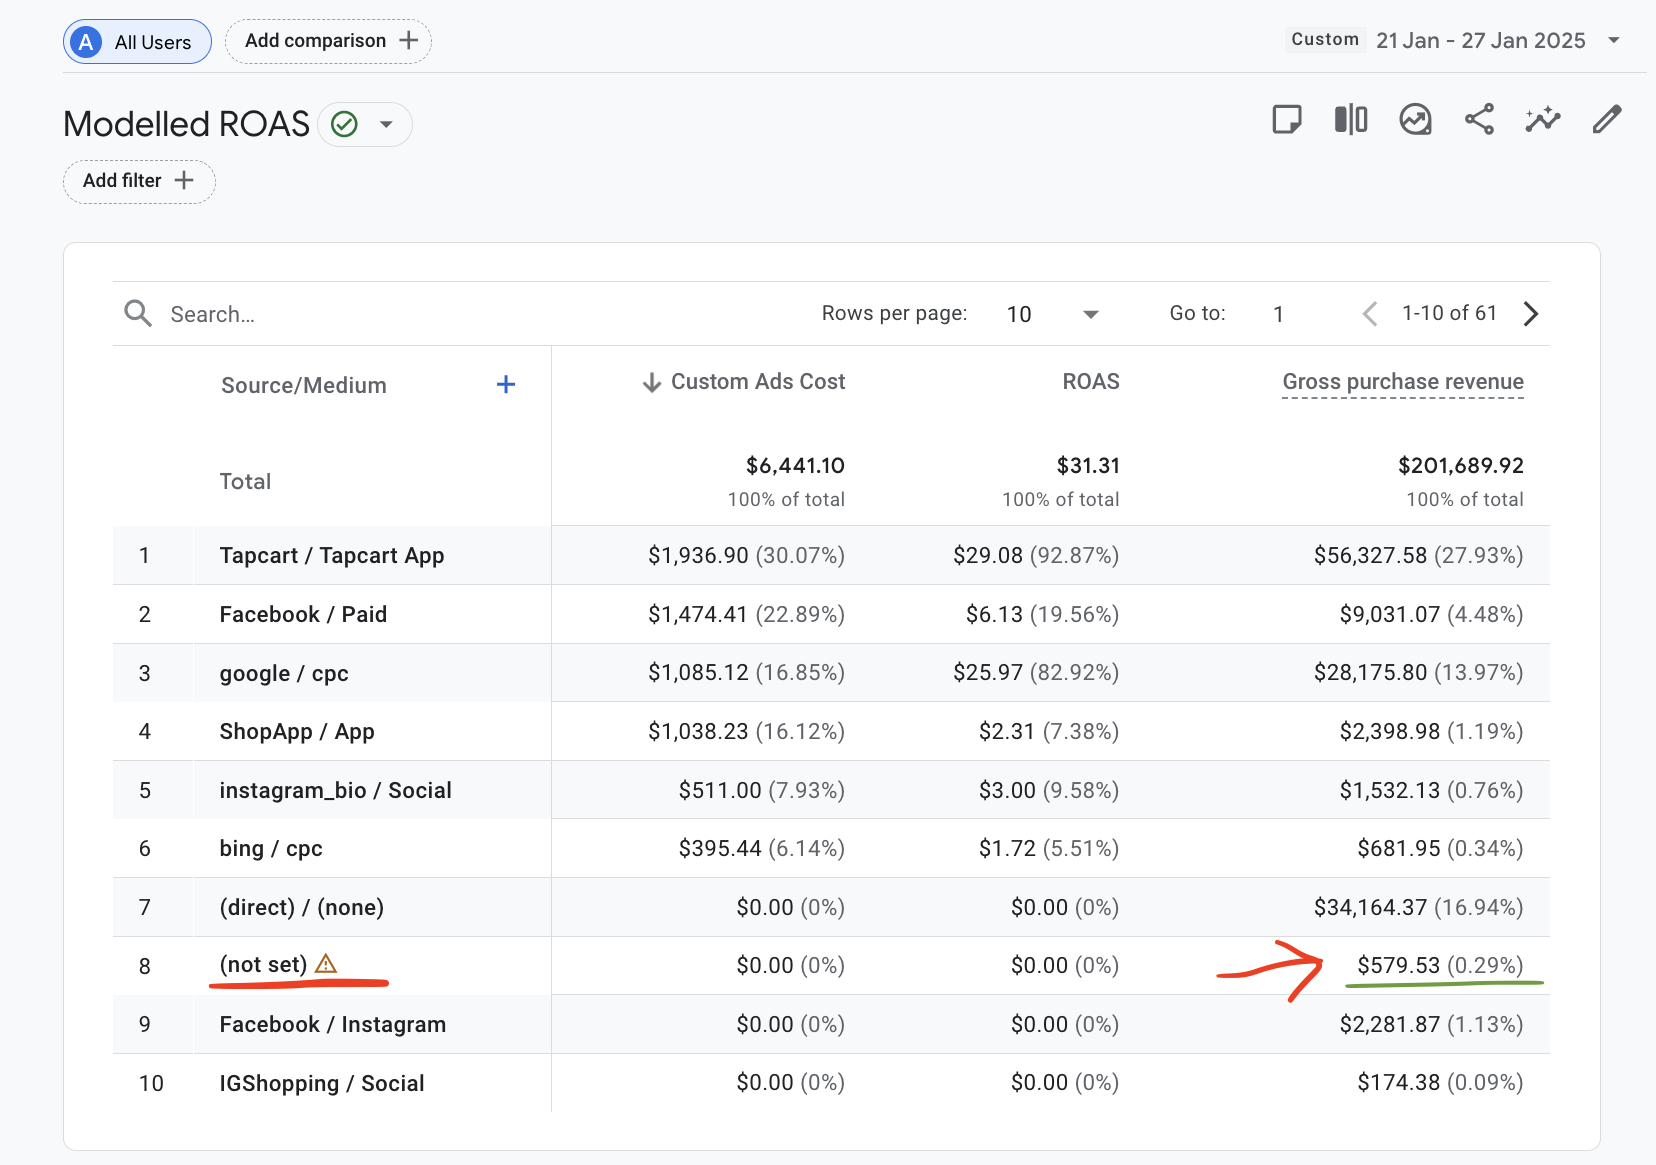
By implementing this approach, you can create a table report that showcases the revenue and the cost generated from traffic attributed to each distinct source/medium pair. This ratio is then translated into the amount earned per dollar spent on advertising.
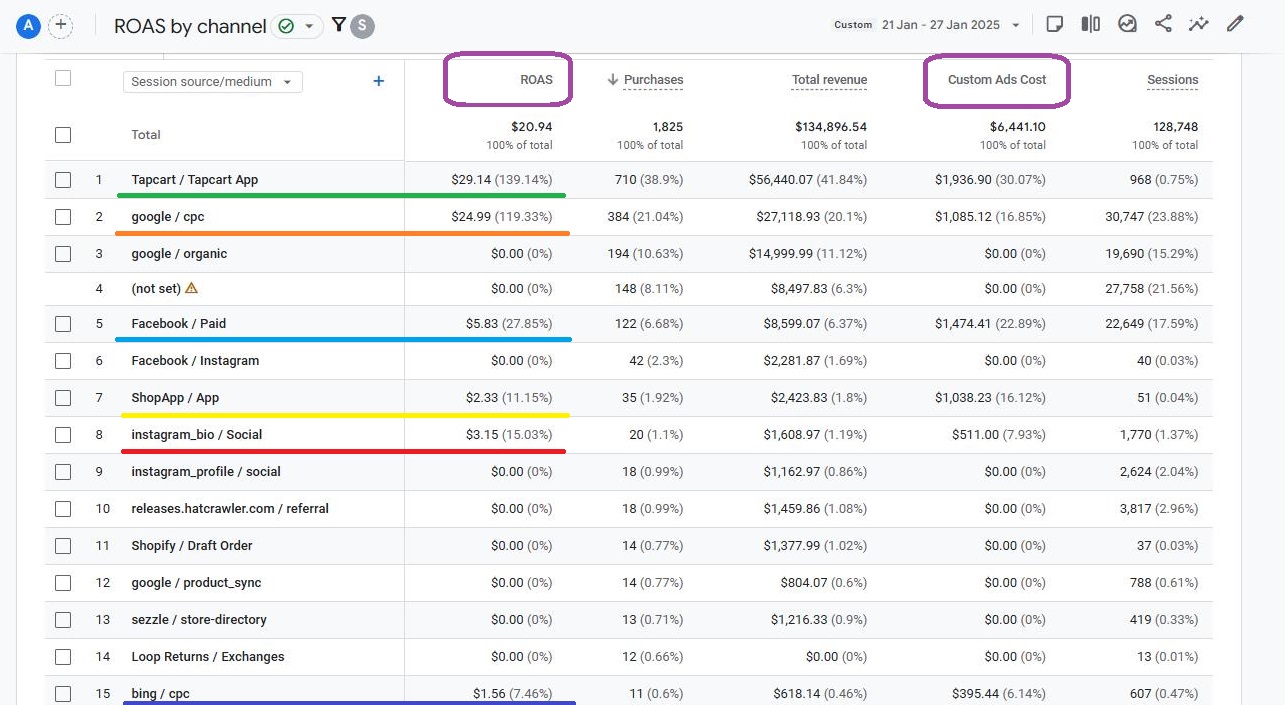
In this guide, we will cover the process of creating such a report step by step: importing ad costs, creating calculated metrics, and integrating ROAS into reports.
Creating Calculated Metrics
Since GA4 does not natively include ROAS as a standard metric, we must create it manually. The formula for ROAS is simple:
ROAS = Total revenue / Ad cost
To set this up in GA4:
-
Navigate to Admin.
-
Go to Custom Definitions.
-
Select Calculated Metrics and create a new calculated metric.
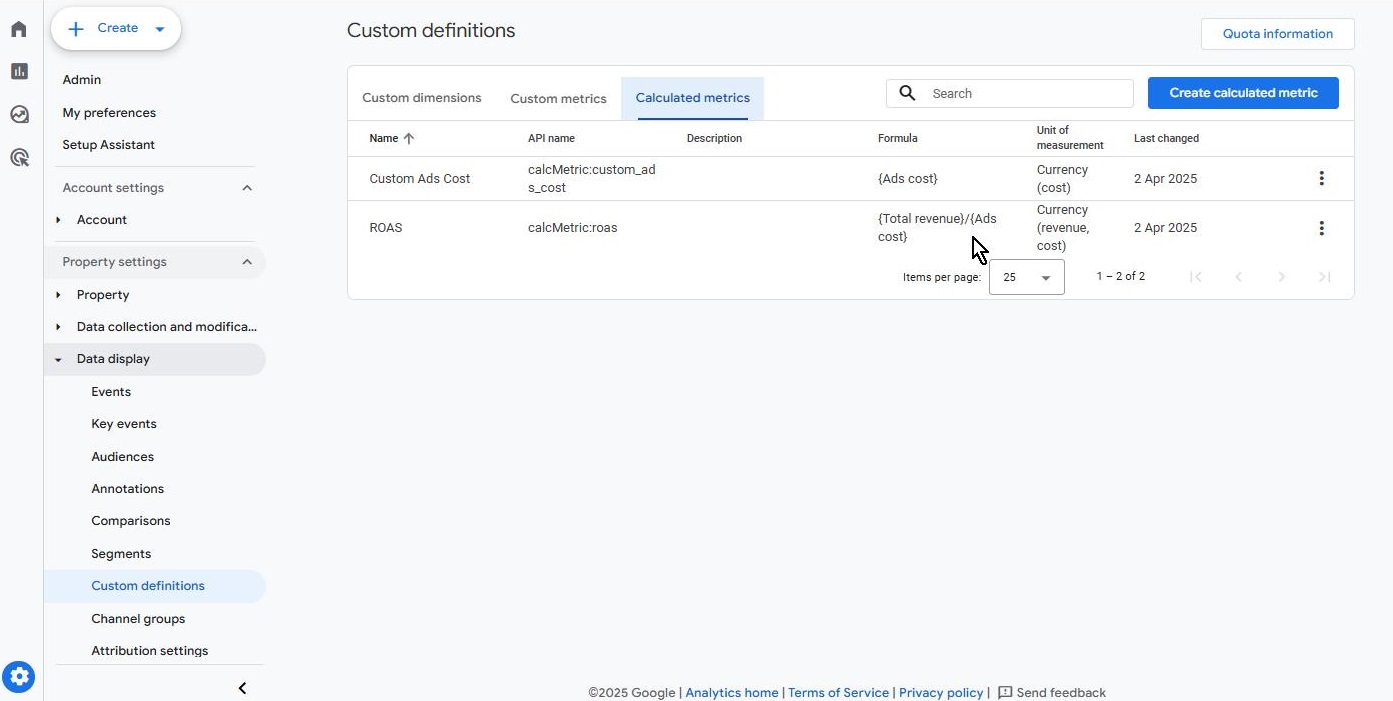
Be aware that GA4 may incorrectly assign a currency format to ROAS despite it being a ratio. This is a known limitation, but the calculation remains valid.
Importing Cost Data
For GA4 to compute ROAS accurately, you must import cost data for each paid advertising channel. This includes sources like Google Ads, Facebook Ads, Tapcart App, and Bing CPC, among others.
The cost data must be formatted correctly in a CSV file. The required fields are:
-
Source (e.g., google, facebook, bing)
-
Medium (e.g., cpc, paid, referral)
-
Date (formatted as YYYY-MM-DD with dashes)
-
Cost (amount spent on ads for that source/medium on the given date)
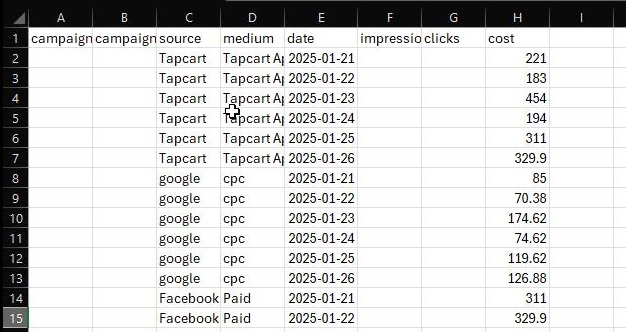
To import the data:
-
Go to Admin in GA4.
-
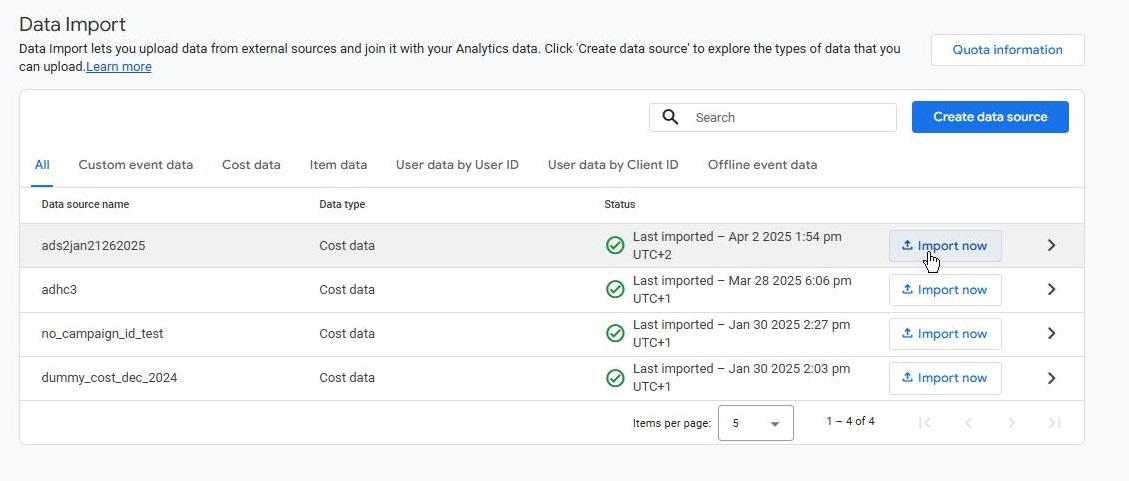
Navigate to Data Import under the Data Collection and Modification section.
-
Upload the CSV file.
-
Map the fields correctly (e.g., map "source" to "session source," and "cost" to "ads cost").
-
Save and process the import.
Please note that the date column should be strictly formatted as Date with dashes!
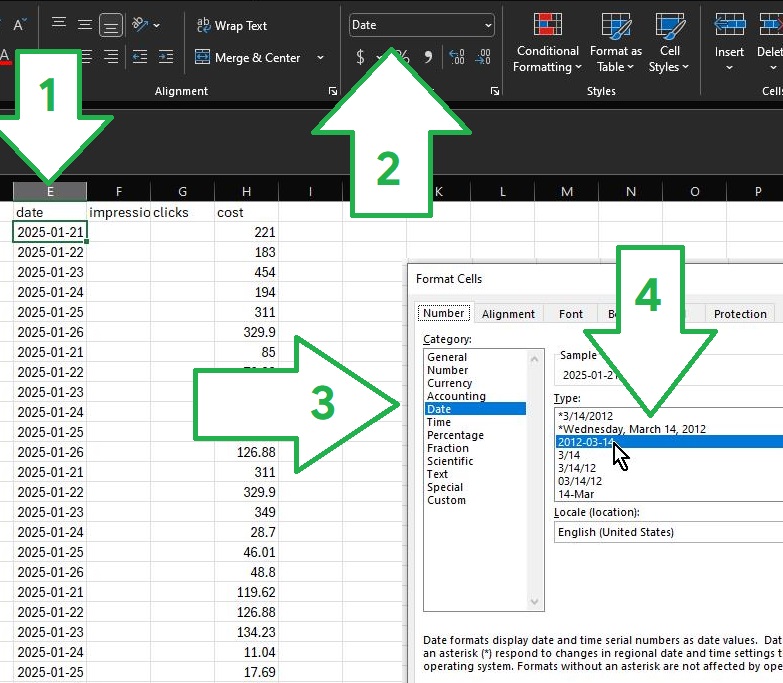
Once imported, you don’t need to setup the import every time to add new cost data, you simply regularly update the CSV file with new cost data.
The easiest way to simplify the process is to maintain a structured CSV file and re-import the same file each time you add cost for new dates.
Creating Reports with ROAS
With the calculated metric and imported cost data in place, you can now surface ROAS in GA4 reports. There are multiple ways to do this:
-
Explorations:
-
Navigate to the GA4 Exploration section.
-
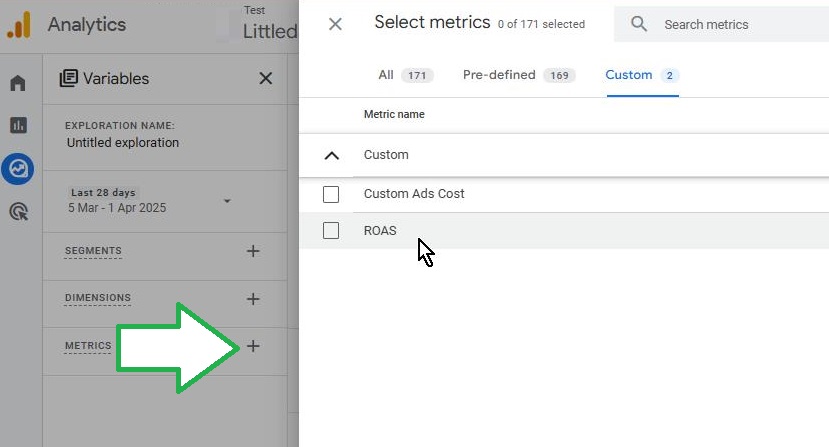
Add ROAS and Custom Ad Cost as custom metrics.
-
Use breakdowns such as Session source/medium to analyze performance.
-
-
Standard Reports:
-
Customize an existing report by adding the ROAS metric.
-
Use the Library section in GA4 to create a new detailed report.
-
Include the created report into a collection and publish
-
ROAS calculated against modelled revenue in GA4 gives you even more complete picture about how your ads perform - note how (not set) revenue dropped below 0.5% which makes ROAS calculation as precise as it gets!
Conclusion
GA4 may not offer ROAS out of the box, but with a few extra steps—importing cost data, creating a calculated metric, and customizing reports—you can analyze your advertising efficiency effectively. By implementing this method, you gain valuable insights into how much revenue each dollar spent on advertising generates, ultimately improving your decision-making process.
Start integrating this today and elevate your ad performance analysis. Happy analyzing!