Landing page mistake that 90% of Shopify brands are making
9 out of 10 customers whose GA4 data we audit do not compare the effect of traffic being sent to Collection pages (a.k.a Product Listing Pages or PLPs) against the traffic sent directly to Product Detail Pages (PDPs).
In this article we’ll show you how to segment this data properly so you can see for yourself the most eye-opening metrics for these two types of pages, but first - let’s answer WHY this might be the low hanging fruit for your ecommerce store.
The Shopify merchant’s dilemma: send traffic to PDPs or PLPs?
Most brands choose a landing page based on "gut feeling". But sending high-intent traffic to a broad collection page is like inviting someone into a massive warehouse when they specifically asked for a hammer. On the other hand, the PDP is an "order taker." It’s high-conversion but also high-friction, if the user isn’t specifically expecting to land on that particular product.
By comparing these traffic segments you’ll see which one suits better a particular business purpose: e.g. do you need to boost AOV? Does your conversion rate seem off? Let’s go into GA4 and we’ll show you how to answer these questions!
Segmenting PDP from PLP landing pages
Open a blank exploration, or the one you already use - doesn’t matter as we need it to create Segment (fwiw you can create it in Admin section but it feels kinda dry there, right?)
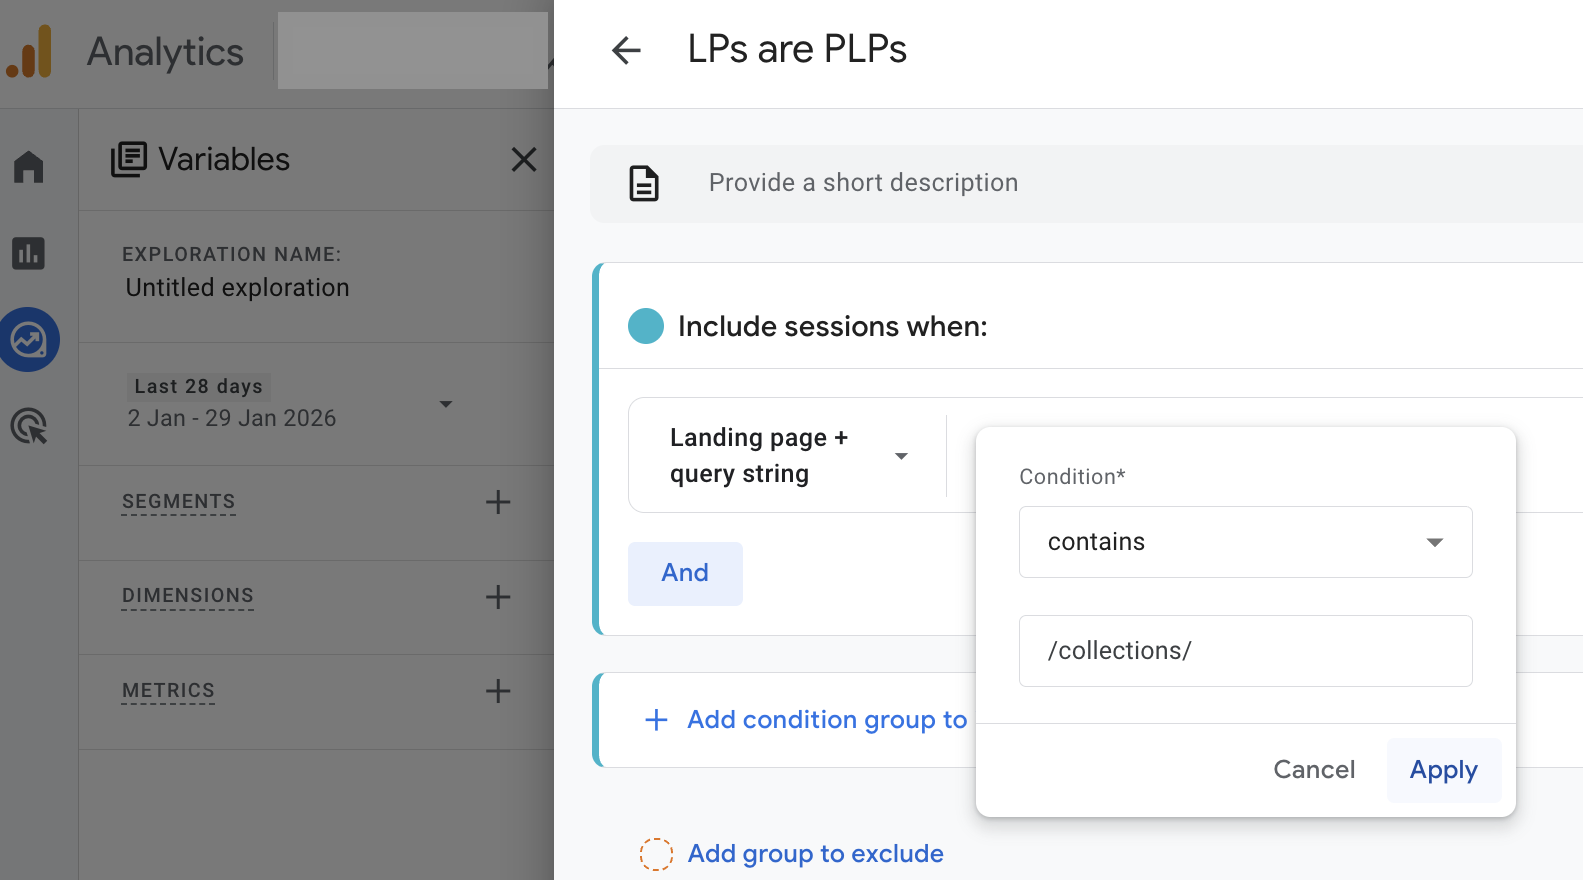
Create a session segment which confirms that Landing page contains /collections/. Repeat the process for another segment but check against /products/ this time, and name the segment accordingly.
The metrics we’re gonna start with are:
-
Sessions
-
Purchases
-
Session conversion rate
-
Average order value
-
Purchase revenue
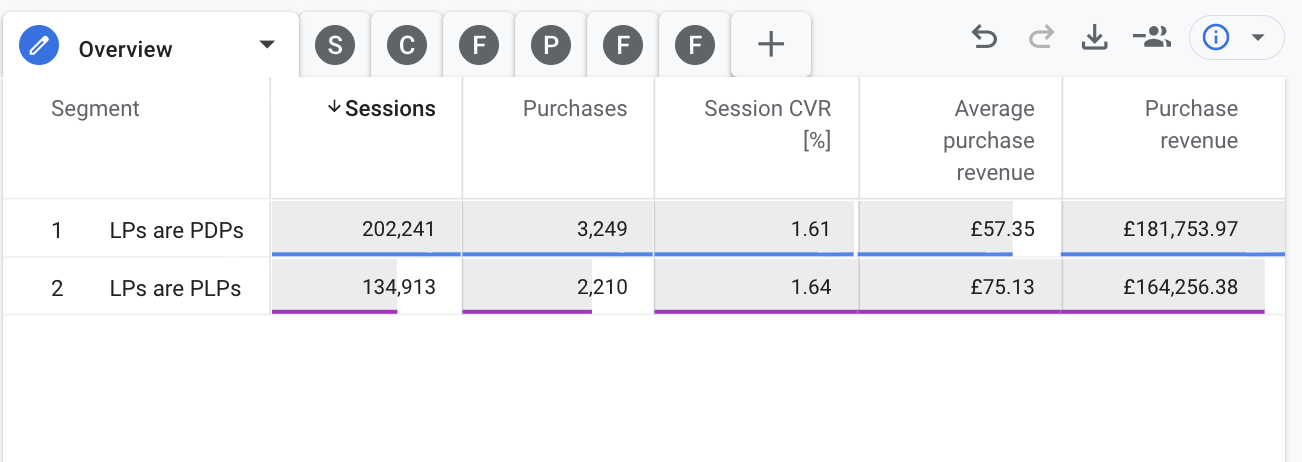
Note the significantly higher AOV (aka Average purchase revenue in GA4 glossary) for PLPs? We can play detectives and deploy various UX theories but the numbers don’t lie - if this brand wants to improve AOV they should send more traffic to PLPs.
Does that mean they should simply generate a new campaign on any platform and point it to generic collections page? Ofc not, and that’s what we’re gonna answer with the next report(s).
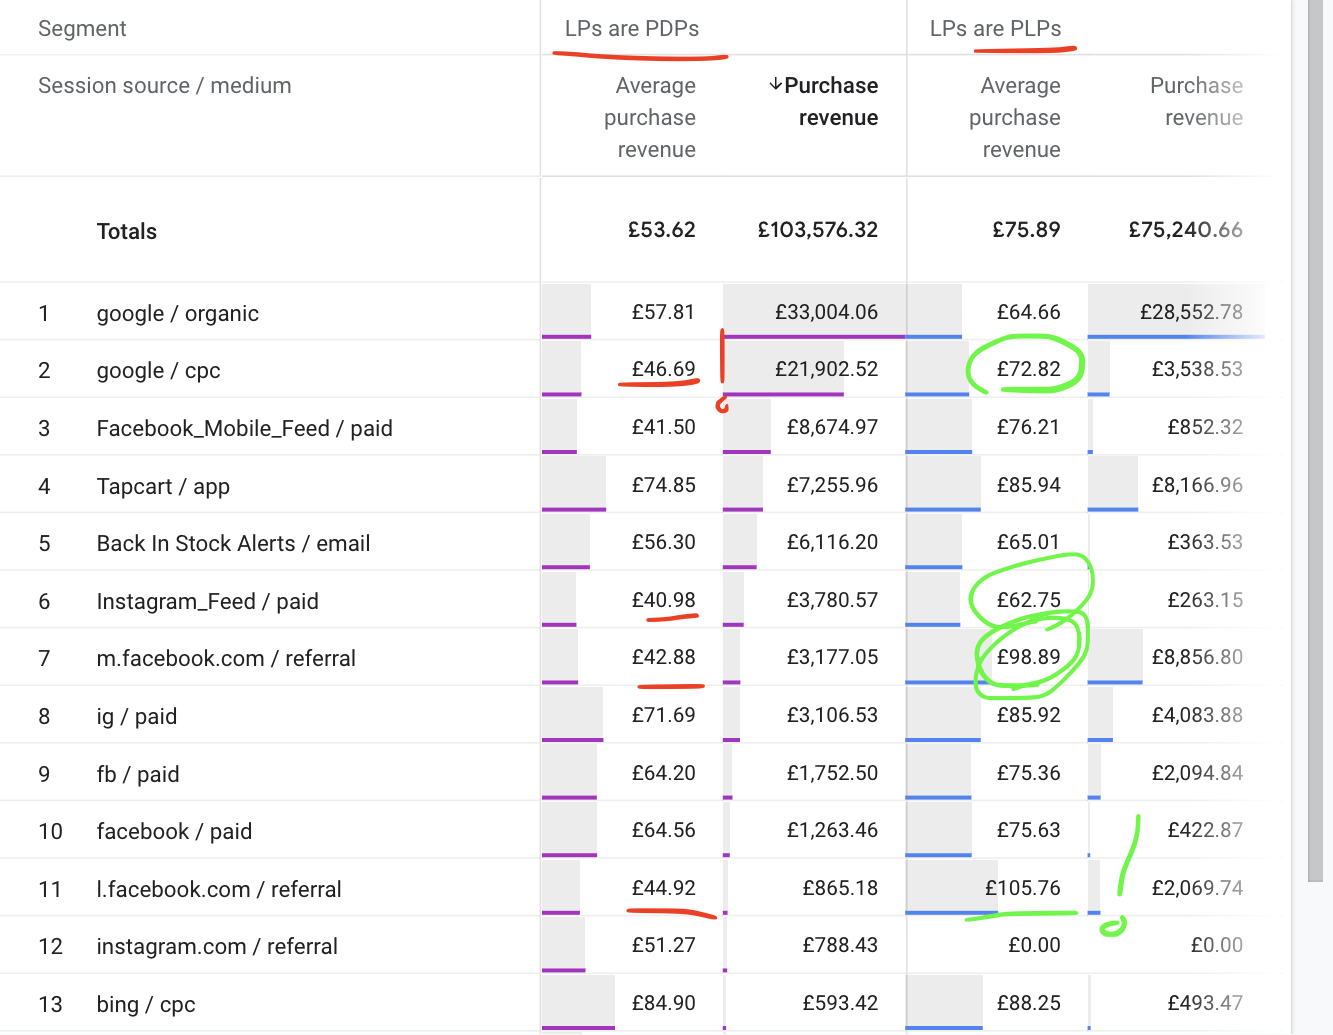
For the same dataset we marked a few rows which should raise this brands advertisers’ eyebrows - why do they have such a discrepancy between AOV from these two traffic types?
One way would be to go deeper in the campaign level, another would be to compare volumes each segment received. They could break down the data further by geo, demographic, device or any other dimension until they notice a pattern.
Or they can just pump more budget into campaigns that use PLPs as LP and less with PDPs 😀
Final thoughts
What will you measure first against Landing page type? Most merchants fixate on conversion rate alone, but the real story often lies in the balance between AOV, Customer Lifetime Value and even a simple user intent (soft conversions) if we’re dealing with a really long sales cycle.
The "PDP vs. PLP" debate is not about finding a universal winner. Instead, it is about identifying which page type performs best for your specific business goals. If your GA4 audit reveals that Collection pages drive higher AOVs, you have a roadmap for your next campaign. By moving away from gut feelings, you can stop treating traffic like a monolith and start directing users toward the most profitable path.
How to make sure your conversion numbers are right and properly tied to traffic source?
These insights are only as valuable as the data powering them. Many Shopify brands suffer from tracking gaps where purchase data is incomplete and/or attribution breaks at checkout.
To get the full picture, you need a tracking partner like Littledata - it collects 100% of Shopify conversions and uses advanced methods for resolving visitor identity. This helps tie purchases and other server side events to the Landing Page, which is a client side dimension, giving you the reliable data needed to scale.